Environmental Sciences — Suggestion Question Bank
Complete Module-wise Solved Answers, Derivations, Numericals & Diagrams (Modules 1–7 · 68 Questions)
Module 1 — Fundamentals of Environment 10 Questions
1. What is acid rain? Why is it called so? Give the chemical reactions and discuss its effects on the environment.
Acid rain refers to any form of precipitation — rain, snow, fog, hail or even dry deposition of particulate matter — that is abnormally acidic, i.e. having an elevated concentration of hydrogen ions ($\text{H}^+$). Normal, unpolluted rainwater is already slightly acidic (pH ≈ 5.6) because atmospheric $\text{CO}_2$ dissolves in it to form weak carbonic acid. Precipitation is termed acid rain when its pH falls below 5.6, often reaching values of 4.0–4.5 in industrial regions.
Why it is called so: The term "acid rain" (coined by Robert Angus Smith, 1872) is used because the primary gaseous pollutants — oxides of sulphur ($\text{SO}_2$) and oxides of nitrogen ($\text{NO}_x$) — released mainly by burning of fossil fuels, undergo oxidation and combine with atmospheric water vapour to produce strong mineral acids (sulphuric acid and nitric acid). These acids are carried down by precipitation, literally making the rain acidic.
Chemical reactions involved:
Sulphuric acid formation:
$$\text{S} + \text{O}_2 \rightarrow \text{SO}_2$$ $$2\,\text{SO}_2 + \text{O}_2 \xrightarrow{\text{(oxidation)}} 2\,\text{SO}_3$$ $$\text{SO}_3 + \text{H}_2\text{O} \rightarrow \text{H}_2\text{SO}_4$$Nitric acid formation:
$$\text{N}_2 + \text{O}_2 \xrightarrow{\text{high temp.}} 2\,\text{NO}$$ $$2\,\text{NO} + \text{O}_2 \rightarrow 2\,\text{NO}_2$$ $$3\,\text{NO}_2 + \text{H}_2\text{O} \rightarrow 2\,\text{HNO}_3 + \text{NO}$$The resulting $\text{H}_2\text{SO}_4$ and $\text{HNO}_3$ dissociate completely in water, releasing $\text{H}^+$ ions and lowering the pH.
Effects on the environment:
- On aquatic ecosystems: Acidification of lakes and rivers (pH < 5) kills fish eggs, plankton and amphibians. Acid also leaches toxic aluminium ($\text{Al}^{3+}$) from soils into water bodies, damaging fish gills.
- On soil: It leaches out essential nutrient cations ($\text{Ca}^{2+}$, $\text{Mg}^{2+}$, $\text{K}^+$), reduces soil fertility and mobilises toxic heavy metals.
- On vegetation and forests: Damages the waxy cuticle of leaves, weakens trees, hampers photosynthesis and causes forest die-back (e.g. the Black Forest of Germany).
- On buildings and monuments: Corrodes limestone and marble ($\text{CaCO}_3$) structures — the "stone leprosy" affecting the Taj Mahal: $$\text{CaCO}_3 + \text{H}_2\text{SO}_4 \rightarrow \text{CaSO}_4 + \text{H}_2\text{O} + \text{CO}_2$$
- On human health: Aggravates respiratory ailments (bronchitis, asthma) and contaminates drinking water with leached metals.
2. What do you understand by 'Maximum Sustainable Yield'? Prove that N = K/2 for maximum sustainable yield.
Maximum Sustainable Yield (MSY) is defined as the largest quantity (yield) of a renewable biological resource — such as fish, timber or game — that can be harvested continuously (year after year) without impairing the ability of the population to renew itself. In other words, it is the maximum rate of harvest that a population can sustain indefinitely. Since the harvestable surplus equals the population's growth rate $\dfrac{dN}{dt}$, the MSY corresponds to the population size at which this growth rate is maximum.
The population is assumed to follow the logistic growth model:
$$\frac{dN}{dt} = rN\left(1 - \frac{N}{K}\right)$$
where $N$ = population size, $r$ = intrinsic growth rate, $K$ = carrying capacity.
Proof that $N = K/2$ gives maximum sustainable yield:
The yield (growth rate) function is
$$G(N) = \frac{dN}{dt} = rN\left(1 - \frac{N}{K}\right) = rN - \frac{rN^2}{K}$$To find the population size $N$ at which the growth rate $G(N)$ is maximum, we differentiate $G$ with respect to $N$ and set the derivative to zero:
$$\frac{d}{dN}\left(\frac{dN}{dt}\right) = \frac{dG}{dN} = r - \frac{2rN}{K}$$Setting $\dfrac{dG}{dN} = 0$ for the turning point:
$$r - \frac{2rN}{K} = 0 \;\Rightarrow\; r = \frac{2rN}{K} \;\Rightarrow\; \boxed{N = \frac{K}{2}}$$Confirming it is a maximum: the second derivative is
$$\frac{d^2G}{dN^2} = -\frac{2r}{K} < 0$$Since the second derivative is negative, $N = K/2$ indeed corresponds to a maximum of the growth-rate curve. Hence the population grows fastest — and therefore yields the greatest harvestable surplus — when it is maintained at half the carrying capacity.
Value of MSY: Substituting $N = K/2$ back into the growth equation:
Thus the maximum sustainable yield equals $\dfrac{rK}{4}$, obtained at a population of $\dfrac{K}{2}$.
3. What is exponential growth of population? Derive the equation and find the doubling time. Also discuss the logistic growth model and why it is more acceptable.
Exponential growth occurs when a population grows at a rate proportional to its current size, under conditions of unlimited resources and no environmental resistance. Each individual reproduces at a constant per-capita rate, so the larger the population becomes, the faster it grows — producing a characteristic J-shaped curve.
Derivation of the exponential equation: Let $N$ be the population at time $t$ and $r$ the intrinsic (per-capita) growth rate ($r = b - d$, birth minus death rate). The rate of increase is proportional to $N$:
$$\frac{dN}{dt} = rN$$Separating the variables:
$$\frac{dN}{N} = r\,dt$$Integrating both sides:
$$\int \frac{dN}{N} = \int r\,dt \;\Rightarrow\; \ln N = rt + C$$Applying the initial condition $N = N_0$ at $t = 0$ gives $C = \ln N_0$. Therefore:
$$\ln N - \ln N_0 = rt \;\Rightarrow\; \ln\!\left(\frac{N}{N_0}\right) = rt$$Taking the exponential of both sides:
Doubling time ($T_d$): The doubling time is the time taken for the population to double, i.e. $N = 2N_0$. Substituting:
$$2N_0 = N_0\, e^{rT_d} \;\Rightarrow\; 2 = e^{rT_d}$$Taking natural logarithms:
$$\ln 2 = rT_d \;\Rightarrow\; \boxed{T_d = \frac{\ln 2}{r} \approx \frac{0.693}{r}}$$Logistic growth model: In reality, resources (food, space, water) are finite, so growth cannot continue unchecked. The logistic model introduces environmental resistance through the carrying capacity $K$ — the maximum population the environment can support:
The term $\left(1 - \dfrac{N}{K}\right)$ is the "braking" factor. When $N$ is small it is ≈ 1 (near-exponential growth); as $N \rightarrow K$ it approaches 0 and growth ceases. This produces a self-limiting S-shaped (sigmoid) curve that levels off at $K$.
Figure 1: Exponential (J-shaped) growth under unlimited resources versus logistic (S-shaped) growth limited by the carrying capacity K. The logistic curve grows fastest at N = K/2 and plateaus at K.
Why the logistic model is more acceptable:
- It is realistic — it accounts for finite resources and environmental resistance, which always exist in nature.
- It predicts a stable equilibrium at $K$, matching observed populations that stabilise rather than growing forever.
- The exponential model implies infinite population, which is biologically impossible; logistic growth is self-regulating.
- It incorporates density-dependent factors (competition, disease, food scarcity) that intensify as $N$ rises.
- It forms the basis of practical concepts like Maximum Sustainable Yield ($N = K/2$), useful in resource management.
4. Write a brief note on: (a) Sustainable Development and its objectives (b) Natural Increase Rate.
(a) Sustainable Development: The concept was popularised by the Brundtland Commission Report "Our Common Future" (1987), which defined it as "development that meets the needs of the present without compromising the ability of future generations to meet their own needs." It seeks a balance between economic growth, environmental protection and social equity (the three pillars of sustainability).
Objectives of Sustainable Development:
- To meet the basic needs (food, water, shelter, energy) of all people, especially the poor.
- To ensure inter-generational equity — conserving resources for future generations.
- To use renewable resources within their regeneration capacity and non-renewables prudently.
- To maintain ecological balance and biodiversity, keeping pollution within the assimilative capacity of the environment.
- To promote clean technologies, recycling and efficient resource use.
- To achieve population stabilisation and social justice (intra-generational equity).
(b) Natural Increase Rate (NIR): The Natural Increase Rate is the rate at which a population grows (or declines) in a given period due to the difference between the number of births and deaths, excluding migration. It is expressed as:
(Since birth and death rates are expressed per 1000 population, dividing by 10 converts to a percentage.)
For example, if the crude birth rate is 30 per 1000 and the crude death rate is 10 per 1000, the NIR = $(30-10)/10 = 2\%$ per year. A positive NIR indicates a growing population; a negative NIR indicates decline. It is a key demographic indicator of population dynamics.
5. Write a brief note on: (a) Total Fertility Rate (b) Total Mortality Rate (c) Age Pyramid.
(a) Total Fertility Rate (TFR): The Total Fertility Rate is the average number of children a woman would bear during her entire reproductive lifetime (roughly ages 15–49) if she experienced the currently prevailing age-specific fertility rates. It is one of the most important indicators of population growth.
- A TFR of about 2.1 is called the replacement level — at which a population exactly replaces itself (the extra 0.1 accounts for infant/child mortality).
- TFR > 2.1 → the population grows; TFR < 2.1 → the population eventually declines.
(b) Total Mortality Rate (Crude Death Rate): The Total (Crude) Mortality Rate is the number of deaths occurring per 1000 individuals of a population in a given year:
It reflects the health status, medical facilities, nutrition and sanitation of a population. A high mortality rate indicates poor living conditions; declining mortality (with high fertility) drives rapid population growth.
(c) Age Pyramid (Age–Sex Pyramid): An age pyramid is a graphical representation of the distribution of a population across different age groups and sexes. Age groups are stacked horizontally (youngest at the bottom), with males on the left and females on the right. Its shape reveals the demographic trend:
- Expanding (broad-based, triangular): high birth and death rates; a young, rapidly growing population (e.g. India, Nigeria).
- Stable / Constant (bell-shaped): birth and death rates roughly balanced; near-zero growth.
- Declining (urn / narrow-based): low birth rate, high proportion of elderly; a shrinking population (e.g. Japan, Germany).
6. Define resource. Classify types of resources and discuss how depletion is caused by population and technological growth.
Definition: A resource is any component of the natural or human environment — material, substance or energy — that is useful and available to satisfy human needs. Examples include water, minerals, forests, soil, air, sunlight, fossil fuels and human labour.
Classification of resources:
- On the basis of origin:
- Biotic resources — obtained from living things (forests, wildlife, fisheries, fossil fuels of biological origin).
- Abiotic resources — obtained from non-living things (minerals, metals, water, air, land).
- On the basis of renewability:
- Renewable (inexhaustible) resources — naturally replenished within a human time-scale (solar energy, wind, water, forests, biomass). They can be over-exploited beyond their regeneration rate.
- Non-renewable (exhaustible) resources — present in fixed amounts and formed over geological ages (coal, petroleum, natural gas, metallic minerals). Once used, they are effectively gone.
- On the basis of availability/development: potential, developed, stock and reserve resources.
Depletion due to population growth:
- A rising population increases per-capita demand for food, water, land, energy and minerals, exceeding the regeneration capacity of renewable resources.
- Expansion of agriculture and settlements causes deforestation, soil erosion and loss of biodiversity.
- Over-extraction of groundwater, over-fishing and over-grazing degrade the resource base faster than it can recover.
Depletion due to technological growth:
- Advanced machinery enables rapid, large-scale extraction (deep mining, mechanised trawling, intensive drilling) that outpaces natural renewal.
- Industrialisation raises consumption of fossil fuels and raw materials, hastening exhaustion of non-renewables.
- A consumerist, throw-away technological culture generates enormous waste and pollution, degrading air, water and soil resources.
The combined pressure is captured by the IPAT relation: $I = P \times A \times T$, where environmental Impact ($I$) depends on Population ($P$), Affluence ($A$) and Technology ($T$).
7. Define Law of Conservation of Mass. Differentiate between conservative and non-conservative substances.
Law of Conservation of Mass: The law states that matter (mass) can neither be created nor destroyed in an ordinary physical or chemical process; it can only be transformed from one form to another. Therefore, in any system, the total mass remains constant. For a defined system boundary this leads to the fundamental mass-balance equation:
This mass-balance principle is the basis for analysing the fate and transport of pollutants in environmental systems (air, water, soil).
Difference between conservative and non-conservative substances:
| Basis | Conservative Substances | Non-conservative Substances |
|---|---|---|
| Definition | Substances that do not decay, degrade or react within the system. | Substances that do decay, react or transform within the system. |
| Decay/Reaction term | Reaction/decay rate = 0. | Reaction/decay rate ≠ 0 (usually first-order, $-kC$). |
| Mass balance | Input = Output + Accumulation. | Input = Output + Reaction + Accumulation. |
| Persistence | Persist indefinitely; diluted or transported only. | Diminish over time by chemical/biological action. |
| Examples | Chlorides, dissolved salts (TDS), heavy metals, some plastics, DDT. | Biodegradable organic matter (BOD), dissolved oxygen, bacteria, radioactive isotopes. |
8. Explain the basic principle of tracking a pollutant in an environment when its concentration entering the system changes suddenly.
The basic principle of tracking a pollutant is the application of the mass-balance (conservation of mass) approach to a well-defined control volume — for instance a lake, a reactor, a room or a river reach — usually idealised as a Completely Mixed / Continuously Stirred System (CSTR) in which the concentration is uniform throughout and equal to the outflow concentration.
General mass-balance principle: The rate of change of mass of the pollutant inside the system equals what enters, minus what leaves, minus what is lost by decay:
where $V$ = volume, $Q$ = flow rate, $C$ = concentration in system, $C_{in}$ = inflow concentration, $k$ = first-order decay constant (for a non-conservative pollutant).
Principle when the input concentration changes suddenly (step change): When $C_{in}$ suddenly changes (e.g. a pollution source is switched on or off), the system does not respond instantaneously; it moves gradually from its old steady state toward a new steady-state concentration following an exponential transient.
Case 1 — Sudden increase to a new steady value: Solving the equation for a step input gives
$$C(t) = C_{\infty} + \left(C_0 - C_{\infty}\right)e^{-\left(\frac{Q}{V} + k\right)t}$$where $C_0$ is the initial concentration and $C_{\infty} = \dfrac{Q\,C_{in}}{Q + kV}$ is the new steady-state concentration. The concentration rises (or falls) exponentially toward $C_{\infty}$.
Case 2 — Source suddenly removed ($C_{in} = 0$): The pollutant simply washes out and decays:
$$C(t) = C_0\, e^{-\left(\frac{Q}{V} + k\right)t}$$Response (residence) time: The speed of the transition is governed by the system time constant $\tau = \dfrac{1}{(Q/V + k)}$; a large volume or small flow makes the system respond slowly. Thus the essential principle is: set up a mass balance over a defined control volume, apply a step change in the input, and solve the differential equation to obtain the exponential approach to the new steady state.
9. What are natural environmental hazards? Discuss causes, effects, and control of Floods, Earthquakes, and Landslides.
Natural environmental hazards are naturally occurring, potentially damaging physical events or processes of the Earth's environment that pose a threat to human life, property and ecosystems. They arise from atmospheric, geological or hydrological processes and become "disasters" when they strike vulnerable human settlements. Examples include floods, earthquakes, landslides, cyclones, droughts and volcanic eruptions.
(i) Floods
- Causes: Heavy or prolonged rainfall, cloudbursts, overflowing rivers, breaching of dams/embankments, poor drainage, deforestation and siltation of river beds, cyclonic storm surges.
- Effects: Loss of life and property, drowning, submergence of crops and soil erosion, spread of water-borne diseases (cholera, typhoid), contamination of drinking water, displacement of people and destruction of infrastructure.
- Control/mitigation: Construction of dams, embankments and reservoirs; afforestation in catchments; desilting and channelisation of rivers; flood forecasting and early-warning systems; proper land-use zoning of flood plains; rainwater harvesting.
(ii) Earthquakes
- Causes: Sudden release of accumulated stress along tectonic plate boundaries/faults, volcanic activity, and sometimes human-induced (reservoir-induced seismicity, deep mining). The point of origin is the focus and the point above it on the surface is the epicentre; magnitude is measured on the Richter scale.
- Effects: Collapse of buildings and bridges, ground fissures, fires, tsunamis (if under the sea), landslides, loss of life and property, disruption of communication and water/power supply.
- Control/mitigation: Earthquakes cannot be prevented, only managed — earthquake-resistant (seismic) building design, enforcement of building codes, hazard-zonation mapping, seismic monitoring, public awareness and disaster-preparedness drills.
(iii) Landslides
- Causes: Down-slope movement of rock, soil and debris under gravity, triggered by heavy rainfall, earthquakes, steep slopes, deforestation, unscientific construction of roads and buildings on hill slopes, and mining/quarrying.
- Effects: Burial of villages, roads and railways; blocking of rivers (forming temporary lakes that may burst); loss of life, property and agricultural land; disruption of hill communication.
- Control/mitigation: Afforestation and vegetation of slopes to bind soil; construction of retaining walls and terracing; proper slope drainage to reduce water saturation; avoiding construction on unstable slopes; slope-stability monitoring and hazard mapping.
10. The Environment (Protection) Act — year enacted. What do you mean by anthropogenic waste and soil pollution?
The Environment (Protection) Act was enacted in 1986 by the Government of India. It was passed in the aftermath of the Bhopal Gas Tragedy (1984) and is an "umbrella legislation" that empowers the Central Government to take all measures necessary to protect and improve the quality of the environment and to prevent, control and abate environmental pollution. It provides for setting standards for emissions and effluents, and lays down penalties for violations.
Anthropogenic waste: The term "anthropogenic" means originating from human activity. Anthropogenic waste therefore refers to the unwanted or discarded materials generated by human activities — as opposed to naturally produced waste. It includes:
- Domestic waste — household garbage, sewage, kitchen refuse, plastics.
- Industrial waste — chemical effluents, fly ash, slag, toxic sludge.
- Agricultural waste — pesticide and fertiliser residues, crop stubble.
- E-waste, biomedical waste and radioactive waste.
Such waste, when not properly treated or disposed, becomes a major source of air, water and soil pollution.
Soil pollution: Soil pollution is the degradation or contamination of the land surface through the addition of harmful substances (chemicals, salts, toxins, pathogens) that adversely affect soil fertility, its physical/chemical/biological properties, and the organisms depending on it. Major causes include:
- Excessive use of chemical fertilisers and pesticides.
- Dumping of industrial and municipal solid waste, and non-biodegradable plastics.
- Discharge of untreated effluents and acid rain leaching nutrients.
- Deforestation and soil erosion; salinity and waterlogging from over-irrigation.
Its effects include loss of soil fertility, reduced crop yield, contamination of groundwater, bioaccumulation of toxins in the food chain and health hazards to humans and animals. Control measures include organic farming, recycling of waste, afforestation, controlled use of agrochemicals and proper solid-waste management.
Module 2 — Ecology 10 Questions
1. What is ecosystem? Classify the components of an ecosystem with a diagram, and describe its abiotic/biotic components for Forest, Grassland, Desert, Aquatic, and Mangrove ecosystems.
The term "ecosystem" was coined by British ecologist A. G. Tansley (1935). An ecosystem is a self-regulating, structural and functional unit of the biosphere in which a community of living organisms (the biotic community or biocoenosis) interacts continuously with one another and with their non-living physical surroundings (the abiotic environment or biotope) as an integrated system, sustained by a one-way flow of energy and a cyclic recycling of nutrients.
Symbolically: $$\text{Ecosystem} = \text{Biotic Community (Biocoenosis)} + \text{Abiotic Environment (Biotope)}$$
Classification of the Components of an Ecosystem:
Figure 1: Structural classification of the components of an ecosystem into abiotic and biotic constituents.
(A) Abiotic (Non-living) Components:
- Climatic factors: Sunlight, temperature, rainfall, humidity, wind, atmospheric pressure.
- Inorganic substances: Carbon dioxide ($\text{CO}_2$), water ($\text{H}_2\text{O}$), nitrogen ($\text{N}_2$), phosphates, sulphates, and mineral salts involved in nutrient cycling.
- Organic substances: Proteins, carbohydrates, lipids, and humus that link the biotic and abiotic worlds.
(B) Biotic (Living) Components:
- Producers (Autotrophs): Green plants and algae that synthesise food from inorganic raw materials via photosynthesis.
- Consumers (Heterotrophs): Primary (herbivores), secondary and tertiary (carnivores), and omnivores that depend on other organisms.
- Decomposers (Saprotrophs): Bacteria and fungi that break down dead organic matter and return nutrients to the abiotic pool.
Comparative account of five major ecosystems:
| Ecosystem | Key Abiotic Components | Producers | Consumers |
|---|---|---|---|
| Forest | High rainfall, rich humus soil, moderate temperature, filtered sunlight, high humidity. | Tall trees (Shorea, Tectona), shrubs, herbs, epiphytes, mosses. | Deer, elephant, insects (herbivores); tiger, leopard, snakes (carnivores). |
| Grassland | Moderate–low rainfall (25–75 cm), seasonal drought, alkaline soil, high sunlight. | Grasses (Cynodon, Dichanthium), sedges, scattered herbs. | Grazers — cattle, deer, rabbit, grasshopper; carnivores — fox, jackal, hawk. |
| Desert | Very low rainfall (<25 cm), extreme temperature range, sandy porous soil, intense sunlight, scarce water. | Xerophytes — cacti (Opuntia), Acacia, succulents, thorny shrubs. | Reptiles, insects, rodents (kangaroo rat), camel; predators — desert fox, snakes. |
| Aquatic | Water medium, dissolved $\text{O}_2$ & $\text{CO}_2$, light penetration, pH, salinity, temperature. | Phytoplankton (diatoms), algae, submerged and floating hydrophytes. | Zooplankton, fish, molluscs, amphibians; large fish, water birds (carnivores). |
| Mangrove | Brackish tidal water, high salinity, waterlogged anaerobic muddy soil, tidal fluctuation. | Salt-tolerant halophytes — Rhizophora, Avicennia, Sonneratia (with pneumatophores & stilt roots). | Mud crabs, prawns, mudskippers, molluscs; kingfishers, herons, estuarine crocodile. |
2. Write down the Nitrogen cycle in nature with a suitable block diagram.
The nitrogen cycle is the biogeochemical cycle by which nitrogen is circulated continuously between the atmosphere, the soil (lithosphere), water bodies (hydrosphere), and living organisms (biosphere). Although the atmosphere contains about 78% free nitrogen ($\text{N}_2$), this inert gas cannot be used directly by most organisms and must first be "fixed" into usable combined forms. The cycle proceeds through five principal steps:
- Nitrogen Fixation: Conversion of atmospheric $\text{N}_2$ into ammonia ($\text{NH}_3$)/ammonium. Achieved by (i) biological fixation — symbiotic bacteria Rhizobium in legume root nodules and free-living Azotobacter, Clostridium, and cyanobacteria (Nostoc, Anabaena); (ii) atmospheric (physical) fixation by lightning; and (iii) industrial fixation (Haber process). $$\text{N}_2 + 8\text{H}^+ + 8e^- \longrightarrow 2\text{NH}_3 + \text{H}_2$$
- Ammonification: Decomposers (ammonifying bacteria and fungi) convert nitrogenous organic wastes and dead remains into ammonia/ammonium ($\text{NH}_4^+$).
- Nitrification: A two-step aerobic oxidation — Nitrosomonas/Nitrococcus oxidise $\text{NH}_4^+$ to nitrite ($\text{NO}_2^-$), then Nitrobacter oxidise nitrite to nitrate ($\text{NO}_3^-$), the chief form absorbed by plants. $$2\text{NH}_4^+ + 3\text{O}_2 \rightarrow 2\text{NO}_2^- + 4\text{H}^+ ;\qquad 2\text{NO}_2^- + \text{O}_2 \rightarrow 2\text{NO}_3^-$$
- Assimilation: Plants absorb nitrates and ammonium to synthesise amino acids, proteins, and nucleic acids; these pass along the food chain to consumers.
- Denitrification: Under anaerobic conditions, denitrifying bacteria (Pseudomonas, Thiobacillus) reduce nitrates back to free $\text{N}_2$, returning it to the atmosphere and completing the cycle. $$2\text{NO}_3^- \longrightarrow 2\text{NO}_2^- \longrightarrow \text{N}_2\text{O} \longrightarrow \text{N}_2 \uparrow$$
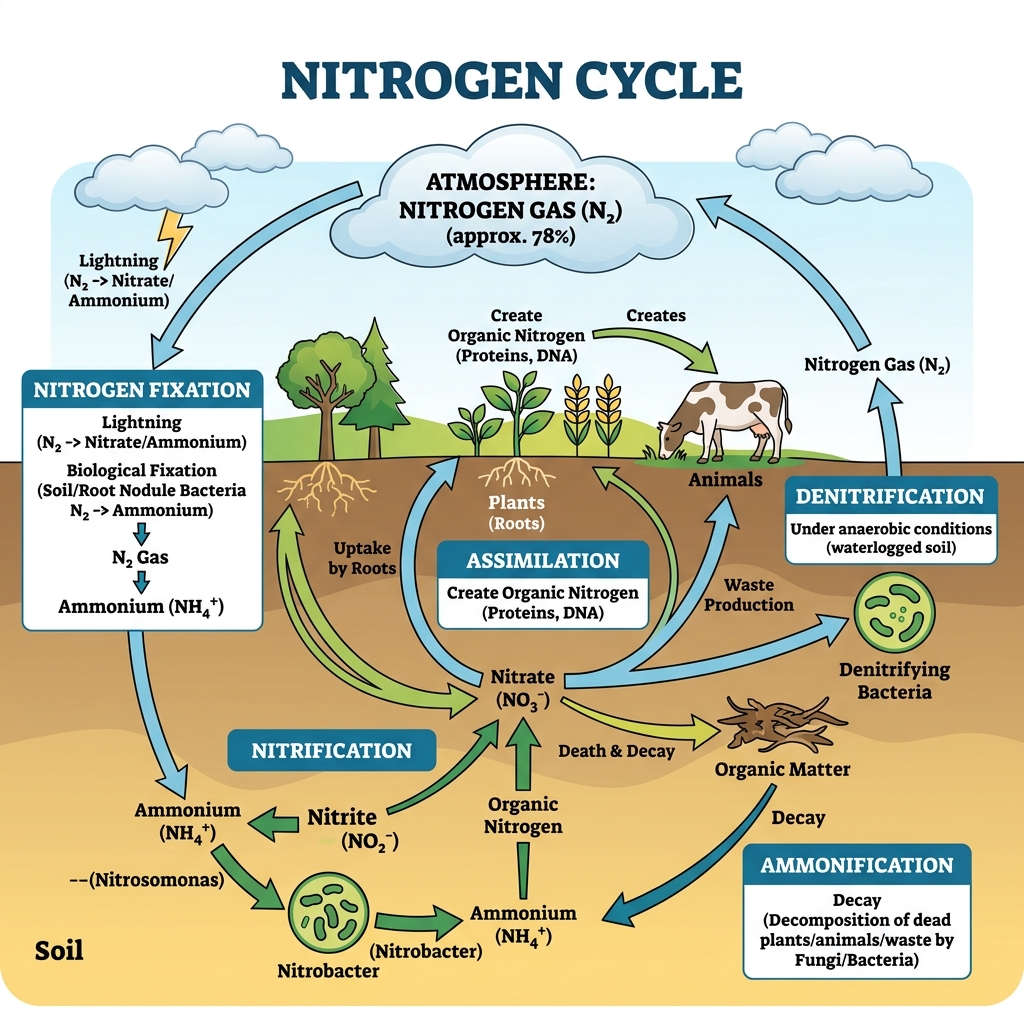
Figure: Block diagram of the Nitrogen cycle in nature.
3. Write down the Oxygen cycle with diagram.
The oxygen cycle is the biogeochemical cycle that describes the continuous movement of oxygen within and between its three main reservoirs — the atmosphere (~21% free $\text{O}_2$), the biosphere (living organisms), and the lithosphere/hydrosphere (oxides, silicates, water, dissolved oxygen). Oxygen is the most abundant element in the Earth's crust and is intimately coupled with the carbon and water cycles.
Principal processes (production and consumption):
- Production (release of $\text{O}_2$): Photosynthesis is the chief source — green plants, algae, and cyanobacteria split water and release molecular oxygen. Photolysis of water vapour in the upper atmosphere by UV radiation contributes a minor amount. $$6\text{CO}_2 + 6\text{H}_2\text{O} \xrightarrow{\text{sunlight}} \text{C}_6\text{H}_{12}\text{O}_6 + 6\text{O}_2$$
- Consumption (removal of $\text{O}_2$): Respiration by all aerobic organisms, combustion (burning of fuels), decomposition of organic matter, and oxidation/weathering of rocks and minerals (formation of oxides). $$\text{C}_6\text{H}_{12}\text{O}_6 + 6\text{O}_2 \longrightarrow 6\text{CO}_2 + 6\text{H}_2\text{O} + \text{Energy}$$
- Ozone formation: In the stratosphere, oxygen is converted to ozone ($3\text{O}_2 \rightleftharpoons 2\text{O}_3$), forming the protective ozone shield against UV radiation.
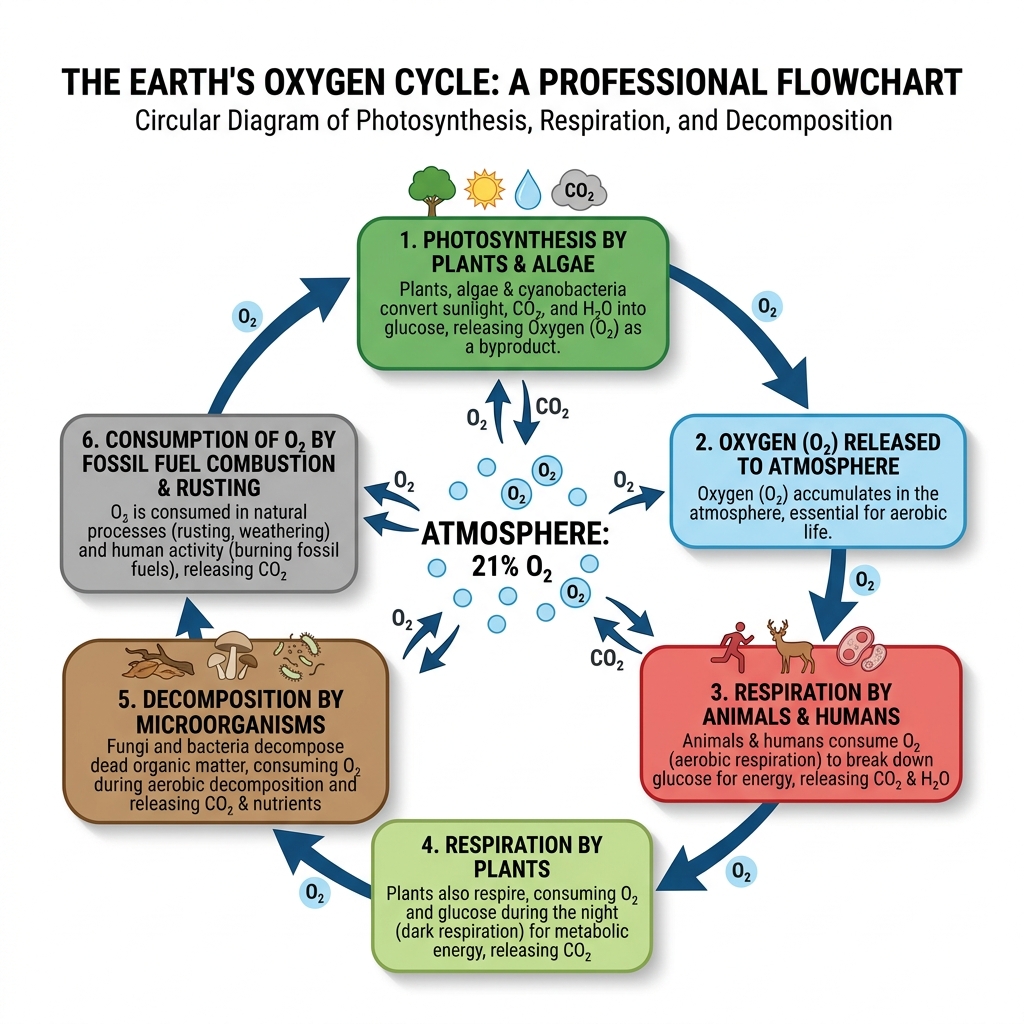
Figure: Block diagram of the Oxygen cycle in nature.
4. Write down: (a) Phosphorus cycle (b) Sulphur cycle in nature with a suitable block diagram.
(a) Phosphorus Cycle: The phosphorus cycle is a sedimentary biogeochemical cycle (it has no significant gaseous phase; the atmosphere plays almost no role). The main reservoir of phosphorus is the lithosphere — phosphate rocks and mineral deposits. Its steps are:
- Weathering: Rainwater and erosion dissolve phosphate ($\text{PO}_4^{3-}$) from phosphate-bearing rocks, releasing it into soil and water.
- Absorption & Assimilation: Plants absorb inorganic phosphates from the soil solution and incorporate them into organic molecules (DNA, RNA, ATP, phospholipids, bones and teeth).
- Transfer through food chain: Herbivores and carnivores obtain phosphorus by feeding.
- Decomposition: Phosphate-solubilising bacteria decompose dead organisms and excreta, returning phosphates to the soil.
- Sedimentation (loss): A portion is lost to deep-sea sediments, becoming locked as rock; it re-enters the cycle only after geological uplift over millions of years. Guano (bird droppings) partially returns marine phosphorus to land.
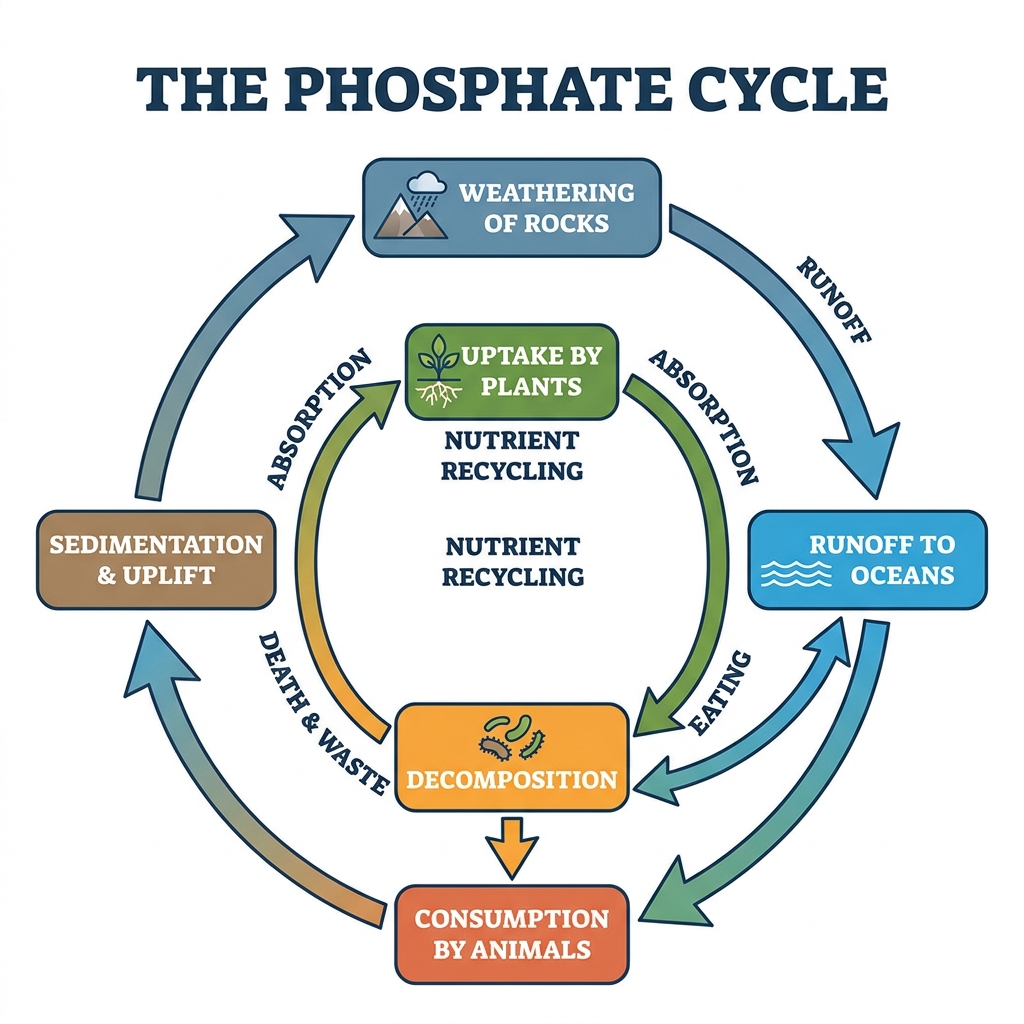
Figure: Block diagram of the Phosphorus (sedimentary) cycle in nature.
(b) Sulphur Cycle: The sulphur cycle is a combined sedimentary and gaseous cycle. Reservoirs include rocks/sediments (pyrites, gypsum), the ocean, and the atmosphere (as $\text{SO}_2$ and $\text{H}_2\text{S}$). Its principal steps are:
- Weathering & release: Rocks weather to release sulphates ($\text{SO}_4^{2-}$); volcanic eruptions, fossil-fuel combustion, and decomposition release $\text{H}_2\text{S}$ and $\text{SO}_2$ into the atmosphere.
- Assimilation: Plants absorb sulphate and build sulphur-containing amino acids (cysteine, methionine); these pass to animals.
- Decomposition & mineralisation: Decomposers (e.g., Aspergillus) release $\text{H}_2\text{S}$ from dead organic matter (desulphurylation).
- Oxidation: Sulphur bacteria (Thiobacillus, Beggiatoa) oxidise $\text{H}_2\text{S}$ and elemental sulphur to sulphates. $$2\text{H}_2\text{S} + \text{O}_2 \rightarrow 2\text{S} + 2\text{H}_2\text{O}; \qquad 2\text{S} + 3\text{O}_2 + 2\text{H}_2\text{O} \rightarrow 2\text{H}_2\text{SO}_4$$
- Reduction: Anaerobic sulphate-reducing bacteria (Desulfovibrio) reduce sulphate back to $\text{H}_2\text{S}$. Atmospheric $\text{SO}_2$ dissolves in rain to cause acid rain, returning sulphur to the soil.
5. What is biodiversity? Discuss in-situ and ex-situ conservation methods; define endemic species and biodiversity hotspot.
Biodiversity (biological diversity), a term popularised by E. O. Wilson, is the totality, variety, and variability among all living organisms on Earth and the ecological complexes of which they are part. It operates at three hierarchical levels: genetic diversity (variation of genes within a species), species diversity (variety of species in a region), and ecosystem diversity (variety of habitats, communities, and ecological processes).
Conservation Methods:
| Basis | In-situ Conservation | Ex-situ Conservation |
|---|---|---|
| Meaning | Conservation of species within their natural habitat ("on-site"). | Conservation of species outside their natural habitat ("off-site") in controlled conditions. |
| Examples/Methods | National parks, wildlife sanctuaries, biosphere reserves, sacred groves, biodiversity hotspots. | Zoological parks, botanical gardens, gene banks, seed banks, cryopreservation, tissue culture, captive breeding. |
| Advantages | Organisms evolve naturally; cost-effective; whole ecosystem is protected. | Complete protection & monitoring; useful for critically endangered species; enables reintroduction. |
| Limitations | Large area needed; vulnerable to poaching & natural calamities. | Expensive; limited genetic diversity; loss of natural adaptations. |
- Endemic Species: Species that are naturally restricted to (native and confined to) a particular geographical region and are found nowhere else in the world, e.g., the Nilgiri tahr and lion-tailed macaque of the Western Ghats.
- Biodiversity Hotspot: A term coined by Norman Myers — a biogeographic region that is both exceptionally rich in endemic species (> 1500 endemic vascular plants) and seriously threatened with habitat loss (> 70% of original vegetation already lost). India harbours four hotspots: the Western Ghats–Sri Lanka, Eastern Himalayas, Indo-Burma, and Sundaland (Nicobar Islands).
6. Define food chain. State its principal types with examples. What is food web? Draw the food web for a forest ecosystem.
A food chain is a linear sequence of organisms in an ecological community through which food energy and nutrients are transferred from one trophic level to the next as one organism consumes another. It always begins with a producer and ends with a top carnivore/decomposer.
Principal types of food chain:
- Grazing food chain (GFC): Begins with green plants (producers) and passes to grazing herbivores and then carnivores. It derives energy directly from the Sun. $$\text{Grass} \rightarrow \text{Grasshopper} \rightarrow \text{Frog} \rightarrow \text{Snake} \rightarrow \text{Hawk}$$
- Detritus food chain (DFC): Begins with dead organic matter (detritus), consumed by detritivores and decomposers. It derives energy from detritus rather than directly from the Sun. $$\text{Dead leaves/litter} \rightarrow \text{Earthworm} \rightarrow \text{Frog} \rightarrow \text{Snake}$$
A food web is a network of many interconnected and interlinked food chains within an ecosystem, through which energy and nutrients flow along multiple alternative pathways. It represents the realistic feeding relationships of a community, where a single organism occupies several trophic levels and has more than one food source — this interconnection imparts stability to the ecosystem.
Figure 2: A simplified food web of a forest ecosystem showing interlinked grazing food chains and multiple feeding pathways.
7. Explain "Energy flow" in a food chain in terms of the laws of thermodynamics. Justify: "nutrients are recycled but energy flow is unidirectional."
Energy flow is the transfer of energy from the Sun through the successive trophic levels of an ecosystem. The ultimate source of energy is solar radiation, of which producers capture only about 1–2% and convert it into chemical energy through photosynthesis. This energy then moves up the food chain and is governed by the two laws of thermodynamics:
- First Law (Law of Conservation of Energy): Energy can neither be created nor destroyed, only transformed from one form to another. In an ecosystem, radiant solar energy is transformed into chemical energy (in food) by producers, and this chemical energy is transformed into mechanical and heat energy by consumers — the total energy is conserved.
- Second Law (Law of Entropy): Every energy transformation is accompanied by dissipation/degradation of energy into unavailable heat (entropy increases). Hence at each trophic transfer a large fraction of energy is lost as metabolic heat through respiration, and only a small part is passed on — this is why energy decreases at each successive trophic level.
According to Lindeman's 10% Law, only about 10% of the energy at one trophic level is transferred to the next; the remaining ~90% is lost as heat. This progressive loss is depicted below:
Justification — "nutrients are recycled but energy flow is unidirectional":
- Nutrients are recycled: Chemical nutrients (C, N, P, S, etc.) are finite and are used repeatedly. They move cyclically — from the abiotic reservoir to producers, along the food chain to consumers, and back to the abiotic environment through decomposers — and can be reused indefinitely. Hence matter flows in a closed cycle (biogeochemical cycles).
- Energy flow is unidirectional: Energy enters the ecosystem only from the Sun and flows in one direction: Sun → producers → consumers → decomposers. At every transfer a large part is dissipated as heat (Second Law) and this heat cannot be recaptured or reused by organisms. Energy is therefore not recycled; it must be continuously replenished by fresh solar input. This is why the energy flow is one-way (non-cyclic), whereas nutrients circulate in cycles.
8. Write a brief note on ecological pyramid; also explain the energy pyramid.
An ecological pyramid (or Eltonian pyramid, introduced by Charles Elton) is a graphical representation of the relationship between the various trophic levels of an ecosystem in terms of their number, biomass, or energy content. The producers form the base and successive consumers occupy the higher tiers, with the top carnivore at the apex. There are three types:
- Pyramid of Numbers: Represents the number of individuals at each trophic level. Usually upright (grassland), but can be inverted (e.g., a single tree supporting many insects and birds).
- Pyramid of Biomass: Represents the total dry weight (biomass) of organisms at each level. Generally upright on land but inverted in aquatic (pond) ecosystems, where small phytoplankton support a larger biomass of zooplankton/fish.
- Pyramid of Energy: Represents the amount of energy present at each trophic level per unit area per unit time ($\text{kcal/m}^2/\text{yr}$). It is always upright, because energy is always maximum at the producer level and decreases at each successive level (Second Law of thermodynamics + 10% law).
Energy Pyramid: The energy pyramid graphically shows the flow of energy through trophic levels. Since only ~10% of energy passes to the next level, each tier is much smaller than the one below it, giving a strictly upright pyramid that can never be inverted.
Figure 3: The energy pyramid — always upright — illustrating Lindeman's 10% law of energy transfer between trophic levels.
9. Define trophic level. State the characteristics of a food chain, and define parasitic/detritus food chain with examples.
Trophic level: A trophic level is a specific feeding (nutritional) position or step in a food chain occupied by a group of organisms that obtain their energy in a similar way. The producers occupy the first trophic level ($T_1$), herbivores the second ($T_2$), primary carnivores the third ($T_3$), and so on.
Characteristics of a food chain:
- It always starts with producers (autotrophs) as the first trophic level.
- Energy flow is unidirectional (one-way) and never cyclic.
- At each transfer, energy is lost as heat, so it obeys the 10% law — usually only 4–5 trophic levels exist.
- Members occupy fixed, successive trophic levels; each level depends on the preceding one.
- It is generally not isolated but interlinked with others to form a food web.
- The number and biomass of organisms generally decrease from producers to top consumers.
- Parasitic Food Chain: A food chain that goes from a large host (producer or consumer) to smaller organisms that live on it as parasites, deriving nourishment without immediately killing the host. Energy flows from larger to smaller organisms.
Example: $$\text{Big tree} \rightarrow \text{Fruit-eating birds} \rightarrow \text{Lice \& bugs (ectoparasites)} \rightarrow \text{Bacteria}$$ - Detritus Food Chain: A food chain that begins with dead organic matter (detritus) rather than living producers. Detritivores and decomposers feed upon it and are, in turn, eaten by their predators.
Example: $$\text{Dead leaves / litter} \rightarrow \text{Earthworms \& detritivores} \rightarrow \text{Frog} \rightarrow \text{Snake}$$ It is dominant in mangrove and forest-floor ecosystems and derives its energy from detritus.
10. Write short notes on: (a) Synecology (b) Demography (c) Biome.
- (a) Synecology (Community Ecology): Synecology is the branch of ecology that deals with the study of groups of organisms (communities/populations of different species) as a whole unit, and their relationships and interactions with one another and with their environment. It examines community structure, composition, succession, and energy flow. It is contrasted with autecology, which studies a single individual organism or a single species in relation to its environment.
- (b) Demography: Demography is the statistical study of the dynamics of populations — their size, density, distribution, age structure, and the vital rates that change them over time (birth rate/natality, death rate/mortality, immigration, and emigration). It is expressed as: $$\Delta N = (B + I) - (D + E)$$ Demographic tools such as age-pyramids and life tables help predict population growth trends, useful for resource planning and environmental management.
- (c) Biome: A biome is a large-scale terrestrial (or aquatic) ecological region/unit characterised by a distinct climate (temperature and rainfall) and a dominant type of vegetation and associated animal community adapted to it. Biomes are the largest geographical biotic communities. Major world biomes include tropical rainforest, grassland (savanna/prairie), desert, temperate deciduous forest, taiga (coniferous forest), and tundra. Climate — especially precipitation and temperature — is the chief factor determining the type of biome in a region.
Module 3 — Air Pollution & Control 10 Questions
1. What is greenhouse effect and global warming? Write down the different measures to control global warming.
The greenhouse effect is a natural atmospheric process in which certain trace gases absorb and re-radiate outgoing terrestrial long-wave (infrared) radiation, thereby warming the lower atmosphere and the Earth's surface. Incoming short-wave solar radiation (peaking in the visible band) passes almost freely through the atmosphere and heats the ground. The warmed surface re-emits energy as long-wave infrared radiation ($\lambda \approx 4\text{–}100\ \mu\text{m}$). Greenhouse gases—chiefly water vapour, $\text{CO}_2$, $\text{CH}_4$, $\text{N}_2\text{O}$, $\text{O}_3$ and CFCs—are transparent to the incoming visible light but strongly absorb this outgoing infrared, trapping the heat and keeping the planet habitable. Without this natural blanket the mean surface temperature would be about $-18\,^\circ\text{C}$ instead of the actual $+15\,^\circ\text{C}$.
Global warming is the enhanced greenhouse effect: the gradual rise in the average global near-surface temperature caused by the anthropogenic build-up of greenhouse gases (fossil-fuel combustion, deforestation, industry and agriculture) above natural levels. Atmospheric $\text{CO}_2$ has climbed from a pre-industrial $\sim 280\ \text{ppm}$ to over $420\ \text{ppm}$, and global mean temperature has risen by roughly $1.1\,^\circ\text{C}$ since 1850.
Key relation: The radiative forcing of $\text{CO}_2$ follows a logarithmic law: $$\Delta F = 5.35 \ln\!\left(\frac{C}{C_0}\right)\ \text{W m}^{-2}$$ where $C$ is the current and $C_0$ the reference $\text{CO}_2$ concentration—a doubling of $\text{CO}_2$ produces $\Delta F \approx 3.7\ \text{W m}^{-2}$.
Consequences: polar ice-cap and glacier melt, thermal expansion of oceans and sea-level rise, coastal inundation, increased frequency of heat-waves, droughts and cyclones, shifting monsoon patterns, coral bleaching, and disruption of agriculture and biodiversity.
Measures to Control Global Warming:
- Reduce fossil-fuel dependence: shift to renewable and clean energy—solar, wind, hydro, tidal, geothermal and nuclear—to cut $\text{CO}_2$ emissions at source.
- Improve energy efficiency: efficient appliances, LED lighting, cogeneration, better building insulation and public mass-transit systems reduce per-capita energy demand.
- Afforestation and reforestation: forests act as carbon sinks, sequestering $\text{CO}_2$ through photosynthesis; halting deforestation preserves existing sinks.
- Carbon Capture and Storage (CCS): capture $\text{CO}_2$ from flue gases and sequester it in deep geological formations or spent oil wells.
- Cleaner transport: electric and hybrid vehicles, hydrogen fuel cells, biofuels, and improved public transport lower vehicular $\text{CO}_2$ and $\text{NO}_x$.
- Sustainable agriculture and waste management: curb $\text{CH}_4$ from paddy fields, livestock and landfills; capture landfill gas; promote composting and biogas.
- Policy and international cooperation: carbon taxes, cap-and-trade markets, emission standards, and treaties such as the Kyoto Protocol and Paris Agreement.
- Phasing out synthetic gases: replacing CFCs/HFCs (potent greenhouse gases) under the Montreal Protocol and its Kigali Amendment.
2. Discuss in detail the mechanism of ozone layer depletion by CFCs. How does the Antarctic ozone hole formation take place, and what is its impact?
The ozone layer is a region of the stratosphere ($\sim 15\text{–}35\ \text{km}$ altitude) where ozone ($\text{O}_3$) is concentrated. It absorbs harmful solar ultraviolet-B and UV-C radiation, acting as Earth's protective shield. In the natural undisturbed stratosphere, ozone is continuously created and destroyed in the Chapman cycle:
Natural ozone equilibrium (Chapman mechanism):
$$\text{O}_2 + h\nu\ (\lambda < 242\ \text{nm}) \longrightarrow 2\,\text{O}^\bullet$$
$$\text{O}^\bullet + \text{O}_2 + M \longrightarrow \text{O}_3 + M$$
$$\text{O}_3 + h\nu\ (\text{UV}) \longrightarrow \text{O}_2 + \text{O}^\bullet$$
Depletion mechanism by CFCs: Chlorofluorocarbons (e.g. $\text{CFCl}_3$ — Freon-11, $\text{CF}_2\text{Cl}_2$ — Freon-12), used as refrigerants, aerosol propellants and foam-blowing agents, are chemically inert, non-flammable and insoluble. Because of this stability they are not destroyed in the troposphere and slowly diffuse upward (over 50–100 years) into the stratosphere. There, intense short-wave UV radiation photolyses them, liberating a highly reactive chlorine free radical ($\text{Cl}^\bullet$):
Photodissociation: $$\text{CFCl}_3 + h\nu \longrightarrow \text{CFCl}_2^\bullet + \text{Cl}^\bullet$$
Chain propagation (catalytic destruction):
$$\text{Cl}^\bullet + \text{O}_3 \longrightarrow \text{ClO}^\bullet + \text{O}_2$$
$$\text{ClO}^\bullet + \text{O}^\bullet \longrightarrow \text{Cl}^\bullet + \text{O}_2$$
Net: $$\text{O}_3 + \text{O}^\bullet \longrightarrow 2\,\text{O}_2 \qquad (\text{Cl}^\bullet \text{ regenerated})$$
Because $\text{Cl}^\bullet$ is regenerated at the end of each cycle, it behaves as a catalyst: a single chlorine atom can destroy ~100,000 ozone molecules before it is finally removed as a reservoir species ($\text{HCl}$ or $\text{ClONO}_2$). This chain reaction is the essence of catalytic ozone depletion.
Antarctic Ozone Hole Formation: The dramatic seasonal thinning of ozone (down to <220 Dobson Units) over Antarctica each austral spring (September–October) results from a unique combination of meteorology and chemistry:
- Polar vortex: During the dark, extremely cold Antarctic winter, a strong circumpolar wind (the polar vortex) isolates the air mass, allowing temperatures to fall below $-78\,^\circ\text{C}$.
- Polar Stratospheric Clouds (PSCs): These frigid conditions form ice clouds of nitric acid trihydrate and water. Their surfaces provide sites for heterogeneous reactions that convert inactive chlorine reservoirs into photolytically active forms: $$\text{ClONO}_2 + \text{HCl} \longrightarrow \text{Cl}_2 + \text{HNO}_3$$
- Spring sunrise: When sunlight returns in September, the accumulated $\text{Cl}_2$ is photolysed to $\text{Cl}^\bullet$, triggering massive catalytic ozone destruction (dominated by the $\text{ClO}$ dimer cycle). The result is the sudden, severe "ozone hole."
Impacts of ozone depletion: increased UV-B reaching the surface causes higher incidence of skin cancer (melanoma) and cataracts, suppression of the human immune system, damage to phytoplankton (base of the marine food chain) and reduced crop yields, degradation of plastics and paints, and disturbance of the biogeochemical balance of ecosystems.
3. What is photochemical smog? Briefly describe the formation mechanism of PAN, and differentiate it from sulphurous (London) smog.
Photochemical smog (also called Los Angeles smog or oxidising smog) is a brownish, hazy air pollution formed on warm, sunny days over cities with heavy automobile traffic. It is a secondary pollution produced when primary pollutants—oxides of nitrogen ($\text{NO}_x$) and volatile hydrocarbons (unburnt fuel)—react in the presence of intense sunlight. Its characteristic products are ozone ($\text{O}_3$), peroxyacetyl nitrate (PAN), aldehydes and other photochemical oxidants, giving it strong oxidising, eye-irritating properties.
Formation sequence:
- Morning traffic emits $\text{NO}$ and hydrocarbons (RH). $\text{NO}$ is oxidised to $\text{NO}_2$.
- Sunlight photodissociates $\text{NO}_2$, producing atomic oxygen, which forms ozone: $$\text{NO}_2 + h\nu \longrightarrow \text{NO} + \text{O}^\bullet \qquad \text{O}^\bullet + \text{O}_2 + M \longrightarrow \text{O}_3 + M$$
- Hydrocarbons are attacked by $\text{O}^\bullet$, $\text{OH}^\bullet$ and $\text{O}_3$ to give reactive radicals such as the acetyl (peroxyacyl) radical, which combines with $\text{NO}_2$ to form PAN.
PAN formation mechanism:
$$\text{CH}_3\text{CHO} + \text{OH}^\bullet \longrightarrow \text{CH}_3\text{CO}^\bullet + \text{H}_2\text{O}$$
$$\text{CH}_3\text{CO}^\bullet + \text{O}_2 \longrightarrow \text{CH}_3\text{C(O)OO}^\bullet \ (\text{peroxyacetyl radical})$$
$$\text{CH}_3\text{C(O)OO}^\bullet + \text{NO}_2 \longrightarrow \text{CH}_3\text{C(O)OONO}_2\ (\textbf{PAN})$$
PAN is a powerful eye irritant and phytotoxin. As a "reservoir" of $\text{NO}_x$, it can transport pollution over long distances before decomposing back to $\text{NO}_2$.
| Basis | Photochemical Smog (Los Angeles type) | Sulphurous / London Smog (Classical) |
|---|---|---|
| Chemical nature | Oxidising smog | Reducing smog |
| Principal pollutants | $\text{NO}_x$, hydrocarbons, $\text{O}_3$, PAN, aldehydes | $\text{SO}_2$, sulphuric acid aerosol, smoke, soot, particulates |
| Source | Automobile exhaust | Combustion of coal and fuel oil |
| Conditions favouring | Warm, dry, sunny days; intense UV; summer | Cool, humid, foggy conditions; winter; temperature inversion |
| Time of maximum | Midday / afternoon (needs sunlight) | Early morning |
| Colour / appearance | Brown, hazy air | Grey / black smoky fog |
| Health effect | Eye irritation, respiratory distress, damages plants | Bronchial irritation, respiratory illness (1952 London disaster) |
4. Differentiate between Ambient Lapse Rate and Adiabatic Lapse Rate. What do you mean by temperature inversion and atmospheric stability (ELR vs ALR)?
The lapse rate is the rate at which atmospheric temperature decreases with an increase in altitude. Two distinct lapse rates govern the vertical behaviour and dispersion capacity of the atmosphere.
Ambient (Environmental) Lapse Rate — ELR: the actual, observed temperature decline of the surrounding still air with height, measured by a radiosonde. Its value varies with weather; on average $\approx 6.5\,^\circ\text{C km}^{-1}$.
Dry Adiabatic Lapse Rate — DALR (ALR): the rate at which a rising parcel of dry air cools purely by adiabatic expansion (no heat exchange with surroundings). It is a fixed physical constant: $$\Gamma_d = \frac{g}{c_p} \approx 9.8\,^\circ\text{C km}^{-1} \approx 1\,^\circ\text{C}/100\ \text{m}$$ (The saturated/wet ALR is lower, $\sim 6\,^\circ\text{C km}^{-1}$, because latent heat is released on condensation.)
| Basis | Ambient / Environmental Lapse Rate (ELR) | Adiabatic Lapse Rate (ALR) |
|---|---|---|
| Definition | Actual measured temperature change of surrounding air with altitude | Theoretical cooling of a rising air parcel due to adiabatic expansion |
| Value | Variable; average $\approx 6.5\,^\circ\text{C km}^{-1}$ | Fixed constant; dry $= 9.8\,^\circ\text{C km}^{-1}$ |
| Nature | Empirical, weather-dependent | Physical constant (thermodynamic) |
| Determined by | Prevailing meteorological conditions | Gravity $g$ and specific heat $c_p$ of air |
| Use | Reference for judging stability | Yardstick compared against ELR |
Atmospheric stability (ELR vs ALR): comparing the ELR with the ALR determines whether the atmosphere resists or promotes vertical mixing of pollutants:
- Unstable (superadiabatic): $\text{ELR} > \text{ALR}$. A displaced parcel stays warmer/lighter than its surroundings and keeps rising—strong vertical mixing, excellent pollutant dispersion (looping plume).
- Neutral: $\text{ELR} = \text{ALR}$. A parcel neither accelerates nor returns (coning plume).
- Stable (subadiabatic): $\text{ELR} < \text{ALR}$. A rising parcel becomes cooler/denser than the surroundings and sinks back—suppressed mixing, poor dispersion (fanning plume).
Temperature inversion: the extreme stable case in which the ELR becomes negative—temperature increases with altitude. A warm air layer caps the cooler air below like a lid, completely halting vertical mixing. Pollutants are trapped near the ground and accumulate to dangerous concentrations (as in the 1952 London smog and the Bhopal-type disasters). Inversions form by radiative surface cooling on clear calm nights (radiation inversion) or by the subsidence of descending high-pressure air.
Figure: Temperature–altitude profiles showing ELR relative to the Dry Adiabatic Lapse Rate for unstable, stable and temperature-inversion conditions.
5. What is Maximum Mixing Depth and Ventilation Coefficient? Explain effective stack height and the Gaussian plume model.
Maximum Mixing Depth (MMD): the vertical height (measured from the ground) up to which vigorous convective mixing of the atmosphere occurs during the day. It is the depth of the layer within which pollutants can be dispersed and diluted. It is obtained by drawing the dry adiabatic lapse line from the maximum surface temperature up to the point where it intersects the ambient (environmental) temperature profile. A large MMD means good vertical dilution; a small MMD (as under an inversion) means pollutants are confined to a shallow layer, raising ground-level concentrations.
Ventilation Coefficient (VC): a measure of the atmosphere's capacity to disperse pollutants, defined as the product of the mixing depth and the average wind speed within that layer:
$$\text{VC} = \text{MMD} \times \bar{u}\ \ (\text{m}^2\,\text{s}^{-1})$$
A low ventilation coefficient ($< 6000\ \text{m}^2\text{s}^{-1}$) indicates stagnant conditions and high pollution potential; a high VC indicates strong ventilation and good air quality.
Effective Stack Height ($H$): the emitted plume rises above the physical chimney top because of its upward momentum (exit velocity) and its buoyancy (being hotter than ambient air). The effective stack height is therefore greater than the physical stack height:
$$H = h_s + \Delta h$$ where $h_s$ = physical stack height and $\Delta h$ = plume rise (momentum + buoyancy). A larger $H$ lifts the plume higher, so the pollutant is diluted through a greater volume before it reaches the ground, reducing the ground-level concentration.
Gaussian Plume Model: the standard mathematical model for predicting the downwind concentration of a pollutant emitted continuously from an elevated point source. It assumes that the time-averaged pollutant concentration is distributed normally (Gaussian) about the plume centre-line in both the crosswind ($y$) and vertical ($z$) directions, with the wind carrying the plume along $x$.
Gaussian plume equation (with ground reflection):
$$C(x,y,z) = \frac{Q}{2\pi\,\bar{u}\,\sigma_y \sigma_z}\ \exp\!\left(-\frac{y^2}{2\sigma_y^2}\right)\left[\exp\!\left(-\frac{(z-H)^2}{2\sigma_z^2}\right) + \exp\!\left(-\frac{(z+H)^2}{2\sigma_z^2}\right)\right]$$
where $C$ = concentration ($\text{g m}^{-3}$), $Q$ = emission rate ($\text{g s}^{-1}$), $\bar{u}$ = mean wind speed, $H$ = effective stack height, and $\sigma_y,\sigma_z$ = horizontal and vertical dispersion coefficients (functions of downwind distance and atmospheric stability class). The ground-level concentration ($z=0$) along the centre-line ($y=0$) simplifies to: $$C(x,0,0) = \frac{Q}{\pi\,\bar{u}\,\sigma_y \sigma_z}\ \exp\!\left(-\frac{H^2}{2\sigma_z^2}\right)$$
Figure: Gaussian plume from an elevated stack—effective stack height $H = h_s + \Delta h$ and the normal (Gaussian) spreading of concentration about the plume centre-line.
6. Name the different equipment for controlling air pollution due to SPM (Electrostatic Precipitator, Cyclone Separator, Bag House Filter, Venturi Scrubber) — explain any one.
Suspended Particulate Matter (SPM) is controlled by four principal classes of collection equipment:
- Electrostatic Precipitator (ESP) — electrostatic charging and collection of particles.
- Cyclone Separator — centrifugal (inertial) separation of coarse dust.
- Bag House Filter (Fabric Filter) — filtration of fine dust through woven fabric bags.
- Venturi Scrubber (Wet Scrubber) — capture of particles by water droplets.
Electrostatic Precipitator (ESP) — explained: The ESP is a highly efficient device (up to 99%, capable of collecting sub-micron particles) widely used in thermal power plants and cement industries. It works on the principle of electrostatic attraction.
- Ionisation: The dirty flue gas passes between a set of thin discharge (emitting) electrodes maintained at a very high negative DC voltage (30,000–75,000 V) and grounded collecting plates. The high potential creates a corona discharge that ionises the surrounding gas.
- Charging: The gas ions bombard and impart a strong negative charge to the suspended dust particles carried in the flue gas.
- Migration & Collection: Under the intense electric field, the negatively charged particles migrate to and deposit on the positively charged (grounded) collecting plates, forming a dust layer. The cleaned gas exits from the top.
- Removal (Rapping): Periodically the plates are mechanically vibrated or rapped, dislodging the accumulated dust cake, which falls into collection hoppers below for disposal.
Advantages: very high efficiency even for fine particles, handles large gas volumes at high temperature, low pressure drop and low operating cost. Limitation: high capital cost and ineffective for particles of certain (high) resistivity.
7. What is a catalytic converter (Three-Way Catalytic Converter)? Explain its working principle in controlling automobile emissions.
A catalytic converter is an emission-control device fitted in the exhaust system of a petrol/diesel vehicle, between the engine manifold and the tailpipe. It converts the three main toxic pollutants in exhaust gas—carbon monoxide ($\text{CO}$), unburnt hydrocarbons ($\text{HC}$), and oxides of nitrogen ($\text{NO}_x$)—into relatively harmless gases through catalysed chemical reactions. Because it treats all three pollutants simultaneously, the modern unit is called a Three-Way Catalytic Converter (TWC).
Construction: a stainless-steel housing containing a ceramic honeycomb monolith with a very large surface area, coated with a "washcoat" carrying precious-metal catalysts—platinum (Pt) and palladium (Pd) for oxidation, and rhodium (Rh) for reduction.
Working principle — two catalytic stages:
(a) Reduction catalyst (Rhodium) — removes $\text{NO}_x$:
$$2\,\text{NO}_x \longrightarrow x\,\text{O}_2 + \text{N}_2$$
(b) Oxidation catalyst (Platinum / Palladium) — oxidises $\text{CO}$ and hydrocarbons:
$$2\,\text{CO} + \text{O}_2 \longrightarrow 2\,\text{CO}_2$$
$$\text{C}_x\text{H}_y + \text{O}_2 \longrightarrow \text{CO}_2 + \text{H}_2\text{O}$$
The catalyst provides an alternative low-activation-energy pathway, allowing these reactions to proceed rapidly at exhaust temperatures. A lambda ($\lambda$) oxygen sensor feeds back to the engine control unit to keep the air-fuel ratio near stoichiometric ($\approx 14.7:1$), the point at which all three reactions run efficiently together.
Important note: catalytic converters require unleaded petrol, because lead "poisons" (deactivates) the precious-metal catalyst surface, destroying its activity permanently.
8. Write short notes on: (a) Montreal Protocol (b) Kyoto Protocol — compare the two.
(a) Montreal Protocol (1987): "The Montreal Protocol on Substances that Deplete the Ozone Layer" is an international treaty, signed in 1987 and effective from 1989, framed under the Vienna Convention (1985). Its objective is to protect the ozone layer by phasing out the production and consumption of ozone-depleting substances (ODS)—chiefly CFCs, halons, carbon tetrachloride and HCFCs. It is regarded as the most successful environmental treaty ever: universally ratified, it has led to a measurable recovery of stratospheric ozone. The Kigali Amendment (2016) extended it to phase down HFCs (potent greenhouse gases).
(b) Kyoto Protocol (1997): Adopted at Kyoto, Japan in 1997 (in force 2005) under the UNFCCC, its objective is to combat global warming by reducing emissions of six greenhouse gases—$\text{CO}_2$, $\text{CH}_4$, $\text{N}_2\text{O}$, HFCs, PFCs and $\text{SF}_6$. It set legally binding emission-reduction targets (average $\sim 5.2\%$ below 1990 levels) on developed (Annex-I) countries during 2008–2012, following the principle of "common but differentiated responsibilities." It introduced three flexible market mechanisms: Emissions Trading, the Clean Development Mechanism (CDM), and Joint Implementation (JI).
| Basis | Montreal Protocol (1987) | Kyoto Protocol (1997) |
|---|---|---|
| Primary aim | Protect the ozone layer | Reduce global warming / climate change |
| Parent framework | Vienna Convention (1985) | UNFCCC / Rio Earth Summit (1992) |
| Substances targeted | Ozone-depleting substances: CFCs, halons, HCFCs, $\text{CCl}_4$ | Greenhouse gases: $\text{CO}_2$, $\text{CH}_4$, $\text{N}_2\text{O}$, HFCs, PFCs, $\text{SF}_6$ |
| Year adopted / in force | 1987 / 1989 | 1997 / 2005 |
| Mechanism | Phase-out schedules; Multilateral Fund | Binding targets; Emissions Trading, CDM, JI |
| Outcome | Highly successful; ozone layer recovering | Partial success; superseded by Paris Agreement (2015) |
9. Explain the internal structure of the atmosphere (Troposphere, Stratosphere, Mesosphere, Thermosphere) and Earth's Albedo/atmospheric radiation window.
The atmosphere is divided vertically into four principal layers based on the way temperature varies with altitude:
- Troposphere (0–12 km): the lowest, densest layer holding ~75% of atmospheric mass and almost all water vapour and weather. Temperature decreases with height (ELR $\approx 6.5\,^\circ\text{C km}^{-1}$) to about $-56\,^\circ\text{C}$ at the tropopause. All weather phenomena and air pollution occur here.
- Stratosphere (12–50 km): temperature increases with height because the ozone layer (at ~15–35 km) absorbs UV radiation. Stable, dry and cloud-free—ideal for jet aircraft cruising. Bounded above by the stratopause ($\approx 0\,^\circ\text{C}$).
- Mesosphere (50–85 km): temperature again decreases with height to the coldest point of the atmosphere ($\approx -90\,^\circ\text{C}$) at the mesopause. Most meteors burn up here.
- Thermosphere (85–500+ km): temperature rises steeply (up to $1200\,^\circ\text{C}$+) as atomic oxygen and nitrogen absorb high-energy solar X-rays and UV. It contains the ionosphere (reflects radio waves) and hosts the auroras. Beyond lies the exosphere merging into space.
Figure: Vertical temperature profile of the atmosphere and its four layers.
Earth's Albedo: the albedo is the fraction of incoming solar radiation reflected back to space by the Earth-atmosphere system without being absorbed. Earth's mean (planetary) albedo is $a \approx 0.30$ (30%), contributed mainly by clouds, atmospheric scattering, ice, snow and light surfaces. The remaining 70% is absorbed, warming the planet. A higher albedo (more ice/clouds) cools the Earth; melting ice lowers albedo and amplifies warming (a positive feedback).
Atmospheric (radiation) window: the atmosphere is largely transparent to outgoing terrestrial infrared radiation in the wavelength band 8–13 µm, called the atmospheric window. Through this "window" heat escapes directly to space, cooling the surface. Greenhouse gases (and especially the pollutant CFCs, which absorb precisely within this window) partly close it, trapping heat and enhancing global warming.
10. Define primary and secondary pollutants with examples (SPM, oxides of C/N/S, PAN); numerical on global temperature model (Stefan-Boltzmann).
Primary pollutants are harmful substances emitted directly into the atmosphere from an identifiable source in the form in which they cause damage. Examples: Suspended Particulate Matter (SPM), oxides of carbon ($\text{CO}$, $\text{CO}_2$), oxides of nitrogen ($\text{NO}$, $\text{NO}_2$, i.e. $\text{NO}_x$), oxides of sulphur ($\text{SO}_2$, $\text{SO}_3$), hydrocarbons, and lead.
Secondary pollutants are not emitted directly; they form in the atmosphere by chemical or photochemical reactions among primary pollutants (often driven by sunlight). Examples: ozone ($\text{O}_3$), PAN (peroxyacetyl nitrate), sulphuric acid and nitric acid (acid rain), aldehydes, and photochemical smog. (Note: $\text{SO}_2$ is primary, but the $\text{H}_2\text{SO}_4$ aerosol it forms is secondary.)
| Basis | Primary Pollutant | Secondary Pollutant |
|---|---|---|
| Origin | Emitted directly from source | Formed in atmosphere by reaction of primaries |
| Examples | SPM, $\text{CO}$, $\text{CO}_2$, $\text{NO}_x$, $\text{SO}_2$, hydrocarbons | $\text{O}_3$, PAN, $\text{H}_2\text{SO}_4$, $\text{HNO}_3$, aldehydes |
| Control | Relatively easier (at source) | Difficult (must control precursor primaries) |
Numerical — Planetary Equilibrium Temperature (Stefan-Boltzmann model):
At radiative equilibrium, the solar energy absorbed by the Earth equals the long-wave energy it emits as a black body (Stefan-Boltzmann law, $E = \sigma T^4$).
- Energy absorbed = (incoming solar flux over the disc of area $\pi R^2$) minus the reflected fraction: $$P_{in} = S(1-a)\,\pi R^2$$ where $S$ = solar constant and $a$ = albedo.
- Energy emitted from the whole spherical surface (area $4\pi R^2$) at temperature $T_e$: $$P_{out} = 4\pi R^2\,\sigma T_e^4$$
- Setting $P_{in} = P_{out}$ and cancelling $\pi R^2$: $$S(1-a) = 4\sigma T_e^4$$
- Solving for the equilibrium temperature: $$\boxed{\,T_e = \left[\frac{S(1-a)}{4\sigma}\right]^{1/4}\,}$$
Worked value for Earth: take $S = 1367\ \text{W m}^{-2}$, albedo $a = 0.30$, and $\sigma = 5.67\times10^{-8}\ \text{W m}^{-2}\text{K}^{-4}$.
$$T_e = \left[\frac{1367\,(1-0.30)}{4 \times 5.67\times10^{-8}}\right]^{1/4} = \left[\frac{956.9}{2.268\times10^{-7}}\right]^{1/4}$$
$$T_e = \left[4.219\times10^{9}\right]^{1/4} \approx 255\ \text{K} \approx -18\,^\circ\text{C}$$
Interpretation: the predicted effective temperature is $\approx 255\ \text{K}\,(-18\,^\circ\text{C})$, whereas Earth's actual mean surface temperature is $\approx 288\ \text{K}\,(+15\,^\circ\text{C})$. The $33\ \text{K}$ difference is precisely the warming supplied by the natural greenhouse effect.
Module 4 — Water Pollution & Control 10 Questions
1. What is Biological Oxygen Demand (BOD)? Discuss the principle of the 5-day BOD test; solve related numerical (ultimate BOD/dilution factor).
Biochemical (Biological) Oxygen Demand (BOD) is defined as the amount of dissolved oxygen (in $\text{mg/L}$ or $\text{ppm}$) consumed by aerobic microorganisms to biochemically oxidise and stabilise the biodegradable organic matter present in a water sample, under standard conditions of temperature ($20^\circ\text{C}$) and time (5 days). It is the single most important index of organic pollution load in sewage and surface waters — a high BOD indicates heavy organic contamination and a correspondingly severe depletion of oxygen available to aquatic life.
Principle of the 5-Day BOD Test ($\text{BOD}_5$): Aerobic bacteria oxidise organic matter, consuming dissolved oxygen ($\text{O}_2$):
$$\text{Organic matter} + \text{O}_2 \xrightarrow{\text{aerobic microbes}} \text{CO}_2 + \text{H}_2\text{O} + \text{Energy} + \text{New cells}$$
Because a strong wastewater contains far more organic matter than the small amount of oxygen dissolvable in water (saturation $\approx 9\ \text{mg/L}$ at $20^\circ\text{C}$), the sample is diluted with well-aerated, nutrient-buffered dilution water so that residual oxygen remains after incubation. The procedure is:
- The dissolved oxygen of the diluted sample is measured immediately ($DO_i$).
- An identical bottle is sealed (airtight, no headspace) and incubated in the dark at $20^\circ\text{C}$ for 5 days (dark to suppress photosynthetic $\text{O}_2$ generation by algae).
- The final dissolved oxygen ($DO_f$) is measured after 5 days.
- The oxygen consumed, scaled up by the dilution, gives the BOD.
The temperature $20^\circ\text{C}$ approximates natural stream conditions, and 5 days is chosen because roughly 60–70% of the ultimate carbonaceous demand is exerted by then, while nitrification (which would falsely inflate the reading) has not yet begun.
General (seeded) dilution formula:
$$\text{BOD} = \frac{(DO_i - DO_f) - (B_i - B_f)(1-P)}{P}$$
where $DO_i, DO_f$ = initial and final DO of the diluted sample; $B_i, B_f$ = initial and final DO of the seed control (blank); and $P$ = dilution fraction $= \dfrac{\text{volume of sample}}{\text{volume of sample} + \text{dilution water}}$. The dilution factor $= 1/P$. For an unseeded sample the seed term vanishes and $\text{BOD} = \dfrac{DO_i - DO_f}{P}$.
Worked Example (dilution factor): $5\ \text{mL}$ of wastewater is diluted to $300\ \text{mL}$ with aerated dilution water (unseeded). Initial DO $=8.2\ \text{mg/L}$; after 5 days DO $=3.0\ \text{mg/L}$.
Dilution fraction $P = \dfrac{5}{300} = 0.01667$, so dilution factor $= 1/P = 60$.
$$\text{BOD}_5 = \frac{DO_i - DO_f}{P} = \frac{8.2 - 3.0}{0.01667} = (8.2 - 3.0)\times 60 = \boxed{312\ \text{mg/L}}$$
Ultimate BOD ($L_0$) and the first-order rate model: BOD exertion follows first-order kinetics — the rate of oxidation is proportional to the organic matter remaining:
$$BOD_t = L_0\left(1 - e^{-kt}\right)$$
where $BOD_t$ = oxygen demand exerted up to time $t$; $L_0$ = ultimate (total) BOD = oxygen required to oxidise all the biodegradable organic matter ($t \to \infty$); and $k$ = deoxygenation rate constant (day$^{-1}$, base $e$; typically $0.2$–$0.3\ \text{day}^{-1}$ for domestic sewage at $20^\circ\text{C}$).
Worked Example (ultimate BOD): If $\text{BOD}_5 = 200\ \text{mg/L}$ and $k = 0.23\ \text{day}^{-1}$, find $L_0$.
$$L_0 = \frac{BOD_5}{1 - e^{-k(5)}} = \frac{200}{1 - e^{-1.15}} = \frac{200}{1 - 0.3166} = \frac{200}{0.6834} \approx \boxed{292.7\ \text{mg/L}}$$
Thus the 5-day test captures $200/292.7 \approx 68\%$ of the ultimate demand, consistent with the standard assumption.
2. What is Chemical Oxygen Demand (COD)? How is it related to BOD? Differentiate BOD and COD.
Chemical Oxygen Demand (COD) is the amount of oxygen (expressed in $\text{mg/L}$) required to chemically oxidise the total oxidisable matter — both biodegradable and non-biodegradable organic compounds plus oxidisable inorganic substances — present in a water sample, using a strong chemical oxidant. The sample is refluxed with an excess of standard potassium dichromate ($\text{K}_2\text{Cr}_2\text{O}_7$) in a boiling $50\%$ sulphuric acid medium, with $\text{Ag}_2\text{SO}_4$ as catalyst and $\text{HgSO}_4$ to mask chlorides:
$$\text{Organic matter} + \text{Cr}_2\text{O}_7^{2-} + \text{H}^+ \xrightarrow{\Delta,\ \text{Ag}_2\text{SO}_4} \text{CO}_2 + \text{H}_2\text{O} + \text{Cr}^{3+}$$
The unreacted dichromate is back-titrated against standard ferrous ammonium sulphate (FAS) using ferroin indicator; the oxidant consumed gives the COD. The test takes only about 3 hours versus 5 days for BOD.
Relationship between COD and BOD: Because chemical oxidation attacks all oxidisable matter while biological oxidation only attacks the biodegradable fraction, COD is always greater than or equal to BOD for the same sample ($\text{COD} \ge \text{BOD}_5$; often $\text{COD} \approx 1.5$–$3 \times \text{BOD}_5$). The ratio $\dfrac{\text{BOD}_5}{\text{COD}}$ is a useful biodegradability index: a value $> 0.5$ indicates readily biodegradable (amenable to biological treatment) wastewater, whereas $< 0.3$ indicates a largely non-biodegradable/toxic effluent better suited to physico-chemical treatment.
| Basis | BOD (Biochemical Oxygen Demand) | COD (Chemical Oxygen Demand) |
|---|---|---|
| Oxidising agent | Aerobic microorganisms (biological) | Strong chemical oxidant ($\text{K}_2\text{Cr}_2\text{O}_7 / \text{KMnO}_4$) |
| Matter measured | Only biodegradable organic matter | Both biodegradable & non-biodegradable + oxidisable inorganics |
| Time required | 5 days (at $20^\circ\text{C}$) | About 3 hours |
| Magnitude | Lower value | Higher value ($\text{COD} \ge \text{BOD}$) |
| Reproducibility | Lower (living organisms, sensitive to toxins) | High (purely chemical, precise) |
| Effect of toxic wastes | Fails / underestimates (bacteria are inhibited) | Unaffected — still oxidises chemically |
| Best use | Assessing biotreatability & natural self-purification | Rapid monitoring of industrial/toxic effluents |
3. What is dissolved oxygen? Why is it considered an important water quality parameter? Describe the Winkler method for its analysis.
Dissolved Oxygen (DO) is the quantity of gaseous molecular oxygen ($\text{O}_2$) physically dissolved in water, expressed in $\text{mg/L}$ or as percent saturation. Its solubility is limited and inversely related to temperature and salinity — at $20^\circ\text{C}$ and 1 atm the saturation value is only about $9.1\ \text{mg/L}$. DO enters water by atmospheric re-aeration (diffusion, turbulence) and by photosynthesis of aquatic plants.
Importance as a water-quality parameter:
- It is essential for the survival of fish and aerobic aquatic life; most game fish require $> 4$–$5\ \text{mg/L}$.
- It sustains the aerobic self-purification of rivers — bacteria need DO to stabilise organic wastes.
- A low DO signals heavy organic pollution / high BOD, eutrophication, or anaerobic (foul, $\text{H}_2\text{S}$-producing) conditions.
- It governs the oxygen sag in streams below a waste outfall (see Q10) and is the master variable in stream-quality modelling.
Winkler's (Iodometric) Method: The classical titrimetric determination of DO, based on the fact that DO oxidises manganous hydroxide to a higher-valency manganic state, which subsequently liberates an equivalent amount of iodine that is titrated.
- Fixation of oxygen: To the sample (collected without air bubbles) add manganous sulphate ($\text{MnSO}_4$) and alkaline potassium iodide ($\text{KOH} + \text{KI}$, "alkali-iodide-azide"). A white $\text{Mn(OH)}_2$ precipitate forms and is immediately oxidised by the dissolved oxygen to a brown manganic (hydrated $\text{MnO}_2$) precipitate:
$$\text{Mn}^{2+} + 2\text{OH}^- \rightarrow \text{Mn(OH)}_2 \downarrow \qquad 2\text{Mn(OH)}_2 + \text{O}_2 \rightarrow 2\text{MnO(OH)}_2 \downarrow \ (\text{brown})$$
- Acidification & iodine release: Concentrated $\text{H}_2\text{SO}_4$ is added; the brown precipitate dissolves and the manganic ion oxidises iodide to liberate free iodine, in exact proportion to the original DO:
$$\text{MnO(OH)}_2 + 2\text{I}^- + 4\text{H}^+ \rightarrow \text{Mn}^{2+} + \text{I}_2 + 3\text{H}_2\text{O}$$
- Titration: The liberated iodine is titrated against standard sodium thiosulphate ($\text{Na}_2\text{S}_2\text{O}_3$) using freshly prepared starch as indicator; the blue colour disappears at the end point:
$$\text{I}_2 + 2\text{Na}_2\text{S}_2\text{O}_3 \rightarrow 2\text{NaI} + \text{Na}_2\text{S}_4\text{O}_6$$
The volume of thiosulphate consumed gives the DO directly (with standard normalities, $1\ \text{mL of } 0.025\ \text{N Na}_2\text{S}_2\text{O}_3 \equiv 0.2\ \text{mg O}_2$). Interference by nitrites is removed by sodium azide (the modified Winkler–Azide method).
4. What is meant by hardness of water? Discuss the principle of the lime-soda process for softening; numerical on hardness as CaCO3.
Hardness is the property of water that prevents lather formation with soap, caused by the presence of dissolved multivalent metallic cations, principally calcium ($\text{Ca}^{2+}$) and magnesium ($\text{Mg}^{2+}$). Hardness is classified as:
- Temporary (carbonate) hardness: due to bicarbonates of Ca and Mg, $\text{Ca(HCO}_3)_2$ and $\text{Mg(HCO}_3)_2$; removable by boiling.
- Permanent (non-carbonate) hardness: due to chlorides and sulphates of Ca and Mg ($\text{CaCl}_2, \text{MgSO}_4$, etc.); not removed by boiling.
By universal convention, all hardness is expressed as an equivalent amount of $\text{CaCO}_3$ (molar mass $100$, equivalent weight $50$), since it allows different ions to be added on a common scale.
$$\text{Hardness as CaCO}_3\ (\text{mg/L}) = \text{mass of ion (mg/L)} \times \frac{50}{\text{equivalent weight of the ion}}$$
Principle of the Lime–Soda Process: Soluble hardness-causing salts are converted to insoluble precipitates ($\text{CaCO}_3$ and $\text{Mg(OH)}_2$) that settle out, using slaked lime $\text{Ca(OH)}_2$ and soda ash $\text{Na}_2\text{CO}_3$.
- Lime removes temporary (carbonate) hardness and magnesium hardness:
$$\text{Ca(HCO}_3)_2 + \text{Ca(OH)}_2 \rightarrow 2\text{CaCO}_3 \downarrow + 2\text{H}_2\text{O}$$
$$\text{Mg(HCO}_3)_2 + 2\text{Ca(OH)}_2 \rightarrow \text{Mg(OH)}_2 \downarrow + 2\text{CaCO}_3 \downarrow + 2\text{H}_2\text{O}$$
- Soda ash removes permanent (non-carbonate) calcium/magnesium hardness by supplying carbonate ions:
$$\text{CaCl}_2 + \text{Na}_2\text{CO}_3 \rightarrow \text{CaCO}_3 \downarrow + 2\text{NaCl} \qquad \text{MgSO}_4 + \text{Na}_2\text{CO}_3 \rightarrow \text{MgCO}_3 + \text{Na}_2\text{SO}_4$$
Worked Numerical (hardness as CaCO3): A water sample contains $\text{Ca}^{2+} = 40\ \text{mg/L}$ and $\text{Mg}^{2+} = 24\ \text{mg/L}$. Find the total hardness as $\text{CaCO}_3$.
Equivalent weight of $\text{Ca}^{2+} = 40/2 = 20$; equivalent weight of $\text{Mg}^{2+} = 24/2 = 12$.
$$\text{Ca hardness} = 40 \times \frac{50}{20} = 100\ \text{mg/L as CaCO}_3$$
$$\text{Mg hardness} = 24 \times \frac{50}{12} = 100\ \text{mg/L as CaCO}_3$$
$$\therefore\ \text{Total hardness} = 100 + 100 = \boxed{200\ \text{mg/L as CaCO}_3}$$
(By the WHO scale this water is "hard": $150$–$300\ \text{mg/L}$.)
5. Define aquifer. Differentiate aquifer from aquitard. State Darcy's law for groundwater flow and define hydraulic conductivity/gradient.
An aquifer is a saturated, permeable geological formation (such as sand, gravel, or fractured/porous rock) that can store and transmit economically significant quantities of groundwater to wells and springs under ordinary hydraulic gradients. Aquifers may be unconfined (water-table aquifers, open to the atmosphere above) or confined (artesian, bounded above and below by impermeable strata and under pressure).
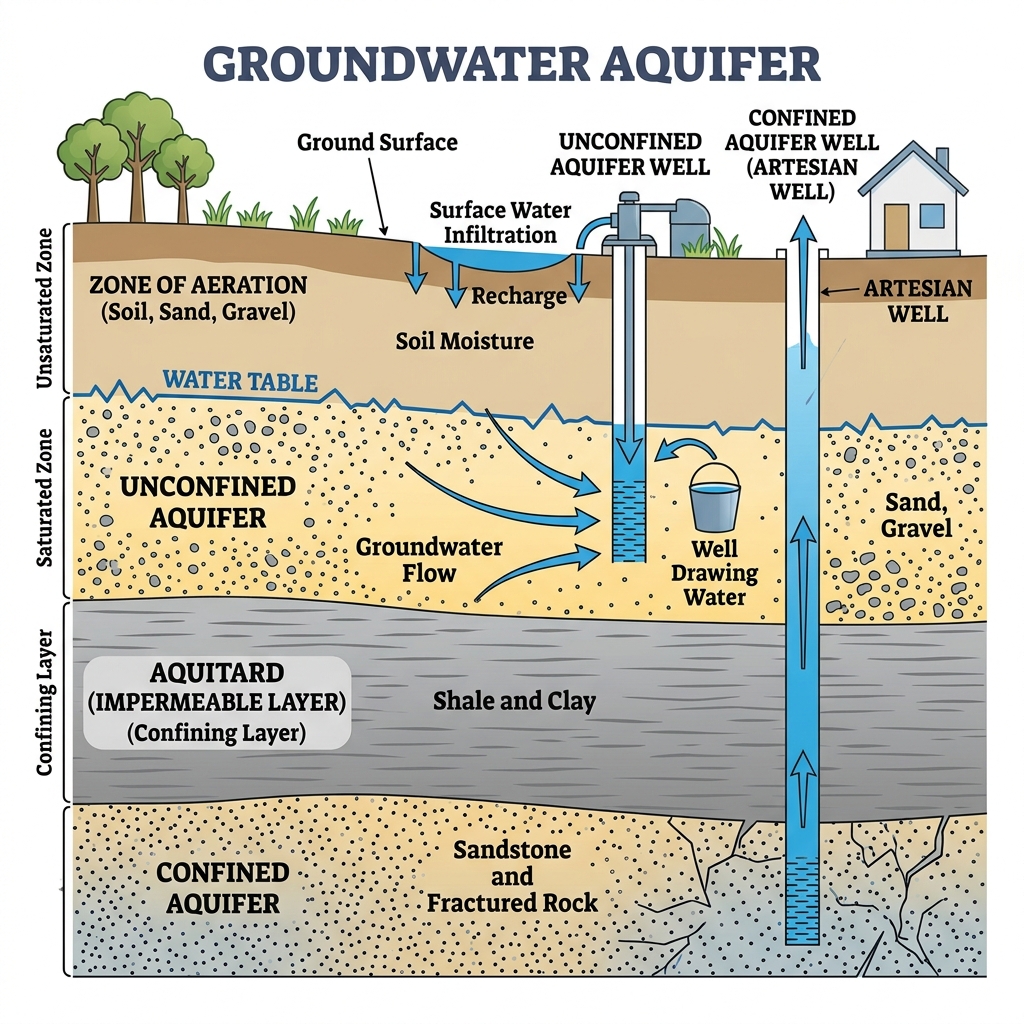
Figure: Aquifer, aquitard and groundwater flow (Darcy's law).
| Basis | Aquifer | Aquitard |
|---|---|---|
| Definition | Formation that stores and readily transmits water | Formation that stores water but transmits it only very slowly |
| Permeability | High (e.g. sand, gravel) | Low / semi-pervious (e.g. silt, clayey sand) |
| Yield to wells | Yields usable quantities of water | Yields negligible water; acts as a leaky barrier |
| Role | Primary source for pumping | Retards/confines flow between aquifers (a true impermeable barrier is an aquiclude) |
Darcy's Law: The 1856 experimental law governing laminar groundwater flow states that the volumetric discharge $Q$ through a porous medium is directly proportional to the cross-sectional area $A$ and the hydraulic gradient, and inversely governed by the permeability of the medium:
$$Q = -KA\frac{dh}{dl}$$
where $Q$ = discharge (m³/s); $A$ = cross-sectional area normal to flow (m²); $\dfrac{dh}{dl}$ = hydraulic gradient; $K$ = hydraulic conductivity. The negative sign indicates flow proceeds in the direction of decreasing hydraulic head. The Darcy (seepage) velocity is $v = Q/A = -K\,\dfrac{dh}{dl}$.
- Hydraulic gradient $\left(\dfrac{dh}{dl}\right)$ = the loss of hydraulic head ($dh$) per unit length of flow path ($dl$); it is the dimensionless slope of the water table / piezometric surface that drives the flow.
- Hydraulic conductivity ($K$) = a proportionality constant (units m/day or m/s) expressing the ease with which a fluid moves through the pore spaces of the medium; it depends both on the medium (grain size, porosity) and the fluid (viscosity, density). High for gravel, very low for clay.
Worked Example: A confined aquifer $2\ \text{m}$ thick and $500\ \text{m}$ wide has $K = 15\ \text{m/day}$; the piezometric head drops $3\ \text{m}$ over a flow length of $1000\ \text{m}$.
$A = 2 \times 500 = 1000\ \text{m}^2$; hydraulic gradient $= 3/1000 = 0.003$.
$$Q = KA\frac{dh}{dl} = 15 \times 1000 \times 0.003 = \boxed{45\ \text{m}^3/\text{day}}$$
6. What are the biochemical effects of Mercury, Lead, Cadmium, and Arsenic on the human body? How do they enter the body and what diseases do they cause?
These heavy metals are non-biodegradable, cumulative protoplasmic poisons. Their common biochemical mechanism is a high affinity for sulfhydryl (–SH) groups of enzymes and structural proteins; by binding these groups they inactivate vital metalloenzymes, disrupt cellular respiration, and undergo bio-accumulation and biomagnification along the aquatic food chain.
| Metal | Route of entry | Biochemical effect | Disease caused |
|---|---|---|---|
| Mercury ($\text{Hg}$) | Ingestion of contaminated fish (as methyl-mercury); inhalation of vapour | Binds –SH enzymes; lipid-soluble methyl-Hg crosses the blood–brain barrier and placenta, destroying neurons | Minamata disease — numbness, ataxia, slurred speech, tremors, blindness, congenital deformities |
| Lead ($\text{Pb}$) | Contaminated water (old lead pipes), leaded paint/petrol dust, food | Inhibits enzymes of heme synthesis (ALA-dehydratase, ferrochelatase); binds –SH groups; damages nerves and kidneys | Plumbism (lead poisoning) — anaemia, "lead line" on gums, abdominal colic, encephalopathy, wrist/foot drop, learning deficits in children |
| Cadmium ($\text{Cd}$) | Drinking water/rice from contaminated fields, cigarette smoke, industrial effluent | Displaces zinc/calcium in enzymes; accumulates in kidney & bone, impairing renal tubules and calcium metabolism | Itai-Itai ("ouch-ouch") disease — severe bone pain, osteomalacia, multiple fractures, kidney (renal tubular) failure, proteinuria |
| Arsenic ($\text{As}$) | Contaminated groundwater (natural aquifer leaching), pesticides, industrial waste | Binds –SH groups, inhibiting pyruvate dehydrogenase and cellular respiration; a known carcinogen | Arsenicosis — skin keratosis & hyperpigmentation, "black-foot disease", peripheral neuropathy, and cancers of skin, lung & bladder |
7. Discuss the Activated Sludge process for wastewater treatment with a flow diagram; describe primary and secondary treatment stages.
Municipal wastewater treatment proceeds in graded stages; the Activated Sludge Process (ASP) is the most widely used secondary (biological) treatment.
Primary Treatment (physical): Removes settleable and floating solids. Wastewater passes through screens (removing rags/large debris) and grit chambers (removing sand/grit), then enters a primary sedimentation (settling) tank where suspended solids settle as raw sludge and grease is skimmed. Primary treatment removes about 60% of suspended solids and 30–35% of BOD, but no dissolved organics.
Secondary Treatment — the Activated Sludge Process (biological): The primary effluent, still rich in dissolved and colloidal organics, flows to an aeration tank where it is mixed with activated sludge (a flocculent mass of aerobic bacteria and protozoa). Air (or pure $\text{O}_2$) is continuously blown in to keep the mixed liquor aerated and in suspension. The microorganisms oxidise the organic matter to $\text{CO}_2$, $\text{H}_2\text{O}$ and new microbial cells:
- Aeration & biological oxidation: Microbes assimilate dissolved organics over a detention time of 4–8 hours, forming a settleable biological floc and lowering BOD by 85–95%.
- Secondary settling (clarification): The mixed liquor flows to a secondary clarifier where the microbial floc settles out, leaving a clear supernatant effluent that is disinfected (chlorination) and discharged.
- Sludge recycle: A portion of the settled sludge is returned to the aeration tank to maintain a high active-microbe population (this "seed" is what makes the sludge "activated").
- Sludge wasting: The surplus (excess) sludge is drawn off for thickening, anaerobic digestion, and disposal.
Figure: Activated Sludge Process — Influent → Primary settling → Aeration tank → Secondary clarifier → Effluent, with sludge recycle.
Tertiary (advanced) treatment may follow to remove residual nutrients (N, P), pathogens and dissolved solids by filtration, adsorption or membrane processes before final discharge.
8. Discuss the working principle of Trickling Filters and the Rotating Biological Contactor (RBC).
Both are attached-growth (fixed-film) aerobic biological secondary-treatment units in which microorganisms grow as a biofilm on a solid medium and oxidise the organic matter of the wastewater flowing past them — in contrast to the suspended-growth Activated Sludge Process.
(a) Trickling Filter: It is a circular tank packed with a bed of coarse filter medium (crushed rock, gravel, or plastic modules, 1–2 m deep) over which the settled sewage is sprinkled from a slowly rotating distributor arm. As the wastewater trickles down over the media, a gelatinous biological slime layer (zoogleal film) of aerobic bacteria, fungi and protozoa develops on the media surface. Organic matter and oxygen diffuse from the trickling liquid into the film, where microbes adsorb and oxidise the organics:
- The bed is naturally ventilated — air passes upward through the void spaces, supplying oxygen for aerobic oxidation.
- As the film thickens, its deeper layers become anaerobic, lose their grip, and slough off ("sloughing"); this detached humus is removed in a following secondary clarifier.
- Part of the effluent is often recirculated to improve efficiency and prevent the media from drying. BOD removal is typically 80–90%.
(b) Rotating Biological Contactor (RBC): It consists of a series of closely spaced, large-diameter circular plastic discs mounted on a horizontal shaft that rotates slowly (1–2 rpm) with about 40% of each disc submerged in a tank of flowing wastewater. A biofilm grows on the disc surfaces. As the shaft rotates:
- When the biofilm is submerged, it adsorbs organic matter from the wastewater.
- When it rotates into the air, the film absorbs atmospheric oxygen, enabling aerobic oxidation — the rotation thus alternately exposes the microbes to food and to air.
- Excess biomass continuously shears off and is settled out in a downstream clarifier.
RBCs need little energy, are compact, easy to operate, tolerate shock loads, and achieve high BOD removal, making them well suited to small and medium communities.
9. What is Eutrophication of a lake/pond? Discuss its causes and control. Describe the hydrological cycle and water balance of the Earth.
Eutrophication is the progressive nutrient enrichment of a water body — chiefly by nitrates ($\text{NO}_3^-$) and phosphates ($\text{PO}_4^{3-}$) — that triggers excessive growth of algae and aquatic plants (algal blooms), whose subsequent death and microbial decay consume the dissolved oxygen, producing hypoxia/anoxia and mass mortality of fish and other aquatic life. It represents the natural ageing of a lake, greatly accelerated by human activity (cultural eutrophication).
Causes:
- Agricultural runoff carrying nitrogen and phosphorus fertilisers.
- Discharge of untreated/partially treated domestic sewage and phosphate-rich detergents.
- Industrial effluents and animal-farm wastes rich in organic nutrients.
Effects: Dense algal mats reduce light penetration, kill submerged plants, deplete DO on decay, release toxins (some blue-green algae), foul odour and taste, and ultimately convert the lake into a marsh.
Control measures:
- Reducing nutrient input at source — advanced (tertiary) nutrient removal from sewage, banning/limiting phosphate detergents, buffer strips and controlled fertiliser use around catchments.
- In-lake remediation — aeration/oxygenation of bottom waters, mechanical harvesting of weeds and algae, dredging nutrient-rich bottom sediments, and dilution/flushing with fresh water.
- Chemical/biological methods — precipitation of phosphorus (e.g. alum dosing) and biomanipulation of the food web.
The Hydrological (Water) Cycle: The continuous, sun-driven circulation of water among the oceans, atmosphere, and land through change of physical state. The chief processes are:
- Evaporation & transpiration (evapotranspiration): Solar energy vaporises water from oceans, lakes and soil, and plants release water vapour.
- Condensation: Rising vapour cools and condenses into clouds.
- Precipitation: Water returns to the surface as rain, snow or hail.
- Runoff & infiltration: Surface runoff feeds rivers back to the oceans, while infiltration recharges groundwater/aquifers.
Global Water Balance: Over a long period the Earth's total water is constant, so total precipitation equals total evaporation. The steady-state balance for any region is expressed as:
$$P = E + R + \Delta S$$
where $P$ = precipitation, $E$ = evapotranspiration, $R$ = runoff, and $\Delta S$ = change in storage (soil moisture + groundwater). Of Earth's water, about 97.5% is saline ocean water and only 2.5% is freshwater — most of which is locked in glaciers and ice caps, leaving under 1% as readily accessible liquid freshwater.
10. Write short notes on: (a) Oxidation Pond (b) Oxygen Sag Curve.
(a) Oxidation Pond (Stabilisation Pond): A shallow (1–1.5 m deep), large earthen basin used for the natural biological treatment of sewage, relying on a symbiotic algae–bacteria relationship driven by sunlight. Aerobic bacteria oxidise the organic waste, consuming oxygen and releasing $\text{CO}_2$, nutrients and ammonia; the algae use this $\text{CO}_2$ and nutrients for photosynthesis and, in turn, release the oxygen the bacteria need:
$$\underbrace{\text{Organic matter} + \text{O}_2 \xrightarrow{\text{bacteria}} \text{CO}_2 + \text{NH}_3 + \text{nutrients}}_{\text{bacterial oxidation}} \qquad \underbrace{\text{CO}_2 + \text{H}_2\text{O} \xrightarrow[\text{algae}]{\text{sunlight}} \text{new algal cells} + \text{O}_2}_{\text{photosynthesis}}$$
The bottom sludge undergoes anaerobic digestion. Oxidation ponds are cheap, need no machinery or energy and little skilled attention, but require large land area and long detention (20–60 days). They are ideal for small towns and rural areas with warm, sunny climates.
(b) Oxygen Sag Curve (Streeter–Phelps curve): When organic waste is discharged into a flowing river, the dissolved oxygen falls below the outfall as bacteria consume $\text{O}_2$ to oxidise the waste (deoxygenation), then recovers downstream as atmospheric re-aeration replenishes it (reaeration). Plotting DO versus distance (or time of travel) downstream gives a characteristic spoon-shaped "sag" curve. The lowest DO point is the critical point ($D_c$), where deoxygenation rate exactly equals reaeration rate; it is the zone of maximum oxygen stress and greatest danger to fish. The net oxygen deficit is governed by:
$$\frac{dD}{dt} = \underbrace{k_d L}_{\text{deoxygenation}} - \underbrace{k_r D}_{\text{reaeration}}$$
where $D$ = DO deficit (saturation DO − actual DO), $L$ = remaining BOD, $k_d$ = deoxygenation constant, $k_r$ = reaeration constant. The four downstream zones are: degradation, active decomposition (sag), recovery, and clean water.
Figure: Oxygen sag curve — DO drops below the waste outfall to a critical minimum ($D_c$), then recovers by re-aeration downstream.
Module 5 — Land Pollution & Control 10 Questions
1. What are the different types of solid waste? Discuss in brief the methods of disposal.
Solid waste refers to any unwanted, useless, or discarded non-liquid and non-gaseous material generated from human, animal, and industrial activities that is abandoned by the generator as having no further immediate economic value. Its scientific management is essential to prevent land, water, and air contamination.
A. Classification (Types) of Solid Waste:
- Municipal Solid Waste (MSW): Everyday domestic and commercial refuse from households, markets, and offices, comprising kitchen garbage, paper, plastics, glass, rags, ash, and street sweepings. It is further split into biodegradable (food, vegetable peels, garden waste) and non-biodegradable (plastics, metals, glass) fractions.
- Industrial Waste: By-products of manufacturing processes — fly ash, metal scrap, chemical sludge, slag, and packaging refuse. May be hazardous (toxic, corrosive, reactive) or non-hazardous.
- Agricultural Waste: Crop residues (straw, husk, bagasse), animal dung, and expired agrochemical containers generated on farms.
- Biomedical / Hospital Waste: Infectious pathological waste, used syringes, soiled dressings, expired drugs, and anatomical body parts from hospitals and clinics.
- Electronic Waste (E-waste): Discarded computers, mobile phones, circuit boards, and batteries containing toxic heavy metals such as Lead ($\text{Pb}$), Mercury ($\text{Hg}$), and Cadmium ($\text{Cd}$).
- Construction and Demolition (C&D) Debris: Concrete rubble, bricks, wood, and steel from building and demolition activities.
- Hazardous Waste: Ignitable, corrosive, reactive, or toxic wastes (chemical solvents, radioactive residues, pesticides) requiring specialised handling.
B. Methods of Disposal (in brief):
- Sanitary Landfilling: Controlled scientific burial of compacted waste in engineered, lined depressions to isolate it from groundwater, with daily soil cover.
- Composting: Aerobic microbial decomposition of biodegradable organic waste into nutrient-rich manure (humus).
- Incineration: Controlled high-temperature combustion ($850$–$1100^\circ\text{C}$) that reduces waste volume by 85–90% and recovers energy.
- Recycling & Material Recovery: Reprocessing of paper, plastics, metals, and glass into secondary raw materials, conserving natural resources.
- Biomethanation (Anaerobic Digestion): Oxygen-free bacterial digestion of organic waste yielding biogas ($\sim 60\%\ \text{CH}_4$) and bioslurry fertiliser.
- Pyrolysis / Vermicomposting: Thermochemical decomposition in the absence of oxygen, or worm-assisted composting, for specific waste streams.
The Integrated Solid Waste Management (ISWM) hierarchy prioritises Reduce → Reuse → Recycle → Recover → Dispose, with landfilling reserved for residual, non-recyclable waste.
2. Write short notes on: (a) Land filling (b) Composting (c) Incineration as methods of solid waste disposal.
(a) Sanitary Landfilling: The most widely used MSW disposal method, involving the controlled scientific burial of compacted solid waste in engineered geological depressions lined with an impermeable composite barrier (High-Density Polyethylene over compacted bentonite clay) to isolate waste from the surrounding soil and groundwater. Each layer is covered daily with 15–20 cm of soil to suppress odour, vectors, and wind-blown litter. Modern engineered landfills incorporate leachate collection pipes and methane gas venting wells; the captured Landfill Gas (LFG, ~50–60% $\text{CH}_4$) is combusted for electricity. Anaerobic decomposition proceeds by methanogenic bacteria:
$$\text{Organic Waste} \xrightarrow[\text{bacteria}]{\text{anaerobic}} \text{CH}_4 \uparrow + \text{CO}_2 \uparrow + \text{Leachate}$$
(b) Composting: The controlled aerobic biochemical decomposition of biodegradable organic waste by thermophilic microorganisms (bacteria, actinomycetes, fungi) into a stable, dark, nutrient-rich humus called compost. The process passes through the following stages:
- Segregation & Shredding: Biodegradable organics (food scraps, vegetable peels, yard waste) are separated and size-reduced to increase surface area.
- Pile Formation: Waste is heaped in windrows/pits maintaining an optimum Carbon:Nitrogen (C:N) ratio of ~30:1 and 50–60% moisture.
- Mesophilic & Thermophilic Phase: Microbial respiration raises the temperature to $55$–$65^\circ\text{C}$, destroying pathogens and weed seeds.
- Turning & Aeration: The pile is periodically turned to supply oxygen and ensure uniform decomposition.
- Maturation (Curing): Organic matter stabilises into humus, ready for use as an organic soil-conditioning manure that improves soil fertility and water retention.
(c) Incineration: The controlled combustion of combustible solid waste at $850$–$1100^\circ\text{C}$ in specialised furnaces. It reduces waste volume by 85–90% and mass by 70–75%, and is especially suited for infectious biomedical and hazardous waste. The intense heat produces high-pressure steam that drives turbines for electricity (waste-to-energy). The sequential operation is:
- Charging: Sorted combustible waste is fed into the primary combustion chamber.
- Primary Combustion: Waste is ignited and burnt with controlled excess air, releasing thermal energy.
- Secondary Combustion: Volatile flue gases are further oxidised at higher temperature to destroy dioxins and furans.
- Heat/Energy Recovery: Hot flue gases raise steam in a boiler to generate power.
- Air Pollution Control: Flue gases pass through electrostatic precipitators, baghouse filters, and lime scrubbers to remove particulates and neutralise acid gases before release.
- Ash Disposal: Inert bottom ash and toxic fly ash are safely landfilled.
| Basis | Landfilling | Composting | Incineration |
|---|---|---|---|
| Principle | Engineered burial & isolation | Aerobic biological decay | Thermal combustion |
| Suitable Waste | Mixed residual, inert waste | Biodegradable organic waste | Combustible, infectious & hazardous waste |
| End Product | Reclaimed land + methane gas | Nutrient-rich compost (humus) | Heat/electricity + inert ash |
| Volume Reduction | Low | Moderate | Very high (85–90%) |
| Cost | Low | Low–Moderate | Very high (capital & O&M) |
| Key Drawback | Leachate & methane emission | Slow; only organics | Dioxin/furan & fly-ash emission |
3. What is meant by hazardous waste? Mention the special care needed for handling and disposal.
Hazardous waste is any waste material — solid, semi-solid, liquid, or containerised gas — that, due to its physical, chemical, biological, or radioactive properties, poses a substantial present or potential threat to human health and the environment when improperly managed. As per the U.S. EPA and India's Hazardous & Other Wastes (Management & Transboundary Movement) Rules, 2016, a waste is classified hazardous if it exhibits any of the four characteristics — the "ICRT" criteria:
- Ignitability: Easily catches fire (flash point below $60^\circ\text{C}$), e.g., waste solvents, petroleum residues.
- Corrosivity: Highly acidic or alkaline ($\text{pH} \le 2$ or $\text{pH} \ge 12.5$) capable of corroding metal/tissue, e.g., spent acids, caustic sludge.
- Reactivity: Chemically unstable, explosive, or reacts violently with water releasing toxic gases, e.g., cyanides, peroxides.
- Toxicity: Harmful or lethal when ingested/absorbed, e.g., heavy metals ($\text{Hg}$, $\text{Pb}$, $\text{Cd}$, $\text{As}$), pesticides, and carcinogens.
Special care needed for handling and disposal:
- Segregation & Labelling: Hazardous waste must be segregated at source and stored in leak-proof, corrosion-resistant, colour-coded containers bearing standardised hazard symbols and material data.
- Trained Personnel & PPE: Handling must be done only by trained workers wearing appropriate Personal Protective Equipment (gloves, respirators, goggles, chemical suits).
- Manifest System & Authorised Transport: A "cradle-to-grave" tracking manifest documents generation, transport, and disposal; transport is done only in licensed, spill-proof vehicles.
- Pre-treatment / Stabilisation: Neutralisation of acids/alkalis, chemical detoxification, and solidification/stabilisation (encapsulation in cement/glass) to immobilise toxins before disposal.
- Secured Landfills: Disposal in Treatment, Storage and Disposal Facilities (TSDF) with double impermeable liners, leachate collection, and long-term monitoring.
- High-Temperature Incineration: Organic hazardous waste is destroyed in dedicated incinerators with rigorous air-pollution control.
- Deep-Well Injection / Encapsulation: Certain liquid and radioactive wastes are injected into deep isolated geological strata or vitrified and stored in shielded repositories.
4. Write a short note on Biomedical waste management.
Biomedical Waste (BMW) is any waste generated during the diagnosis, treatment, or immunisation of humans or animals, or in related research activities, in hospitals, clinics, laboratories, and blood banks. Because it is potentially infectious, pathological, and hazardous, its management in India is governed by the Bio-Medical Waste Management Rules, 2016. Effective BMW management rests on segregation at the point of generation into colour-coded bins:
| Colour Code | Type of Waste | Treatment / Disposal |
|---|---|---|
| Yellow | Human/animal anatomical waste, soiled dressings, expired medicines, chemical waste | Incineration / deep burial |
| Red | Contaminated recyclable plastics — tubing, catheters, IV sets, syringes (without needles) | Autoclaving / microwaving then shredding & recycling |
| White (Puncture-proof) | Sharps — needles, scalpels, blades, broken glass | Autoclaving/disinfection, encapsulation & sharp pits |
| Blue | Broken/discarded glassware, metallic body implants | Disinfection/autoclaving then recycling |
Stages of BMW Management:
- Segregation: Waste is separated at source into the four colour-coded, leak-proof bins.
- Collection & Storage: Bins are collected in labelled containers and stored no longer than 48 hours.
- Transport: Moved in dedicated covered trolleys/vehicles to the treatment facility.
- Treatment: Disinfection by autoclaving, microwaving, or chemical treatment, and destruction by incineration for anatomical/infectious waste.
- Final Disposal: Treated residue and ash are sent to secured landfills or deep-burial pits.
Proper BMW management prevents nosocomial (hospital-acquired) infections, needle-stick injuries, and the spread of pathogens such as Hepatitis B/C and HIV.
5. What is weathering process? Describe different weathering processes briefly.
Weathering is the natural, gradual process of disintegration and decomposition of rocks, minerals, and soils at or near the Earth's surface through the action of physical, chemical, and biological agents, in situ (without transport of the material). It is the first essential step in soil formation (pedogenesis) and the sculpting of landforms. Weathering is broadly classified into three types:
A. Physical (Mechanical) Weathering: Breakdown of rocks into smaller fragments without any change in their chemical composition.
- Frost Wedging (Freeze–Thaw): Water seeping into cracks freezes and expands (~9%), prying the rock apart.
- Thermal Expansion (Exfoliation): Repeated diurnal heating and cooling causes outer rock layers to peel off like onion skins.
- Abrasion: Mechanical grinding of rock surfaces by wind-blown sand, moving water, or glaciers.
- Salt Crystallisation: Growth of salt crystals in pores exerts pressure that fractures the rock.
B. Chemical Weathering: Decomposition of rock-forming minerals through chemical reactions that alter their composition.
- Oxidation: Reaction of minerals with oxygen, e.g., iron rusting: $$4\text{Fe} + 3\text{O}_2 \longrightarrow 2\text{Fe}_2\text{O}_3$$
- Carbonation: $\text{CO}_2$-charged rainwater dissolves carbonate rocks (limestone) forming caves: $$\text{CaCO}_3 + \text{H}_2\text{O} + \text{CO}_2 \longrightarrow \text{Ca(HCO}_3)_2$$
- Hydrolysis: Reaction of silicate minerals (feldspar) with water forming clay minerals.
- Hydration: Absorption of water into a mineral's structure causing swelling, e.g., anhydrite → gypsum.
- Solution: Direct dissolving of soluble minerals such as rock salt in water.
C. Biological Weathering: Disintegration caused by the activity of living organisms.
- Root Wedging: Growing plant roots penetrate and widen cracks in rocks.
- Burrowing: Earthworms, ants, and rodents loosen and expose rock/soil.
- Organic Acids: Lichens, mosses, and decaying organic matter release acids that chemically dissolve minerals.
6. Discuss the internal structure of the Earth with a neat diagram (crust, mantle, core, Moho / Conrad / Gutenberg discontinuities).
The Earth is a stratified, roughly spherical planet whose interior is divided into concentric compositional and mechanical layers, deduced primarily from the study of seismic waves (their velocity, refraction, and reflection). From the surface to the centre (radius ~6371 km), the three principal layers are the crust, the mantle, and the core, separated by sharp transition zones called discontinuities.
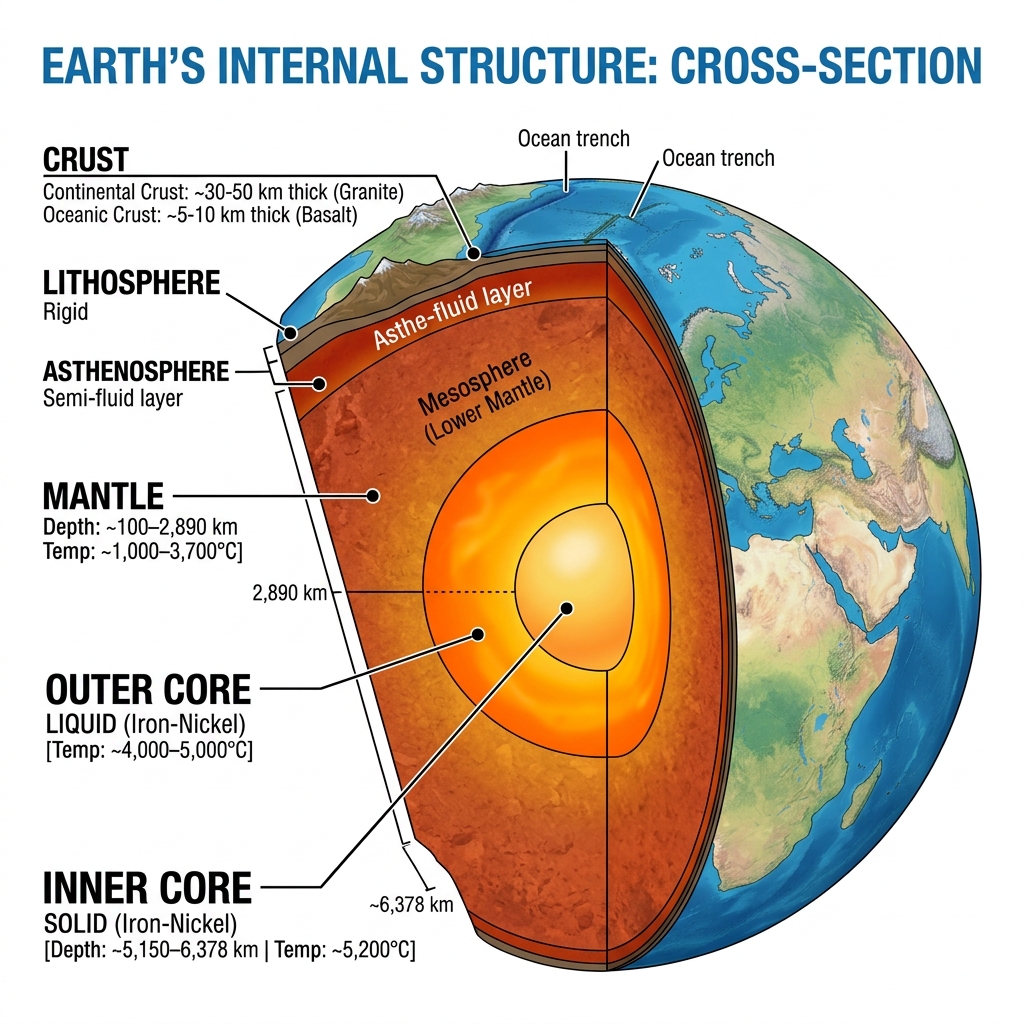
Figure: Internal structure of the Earth — crust, mantle, outer & inner core with Mohorovičić, Conrad and Gutenberg discontinuities.
1. The Crust: The thin, rigid, outermost solid shell (5–70 km thick). It is subdivided into the lighter Sial (continental crust, rich in Silica & Aluminium, granitic, avg. density $\sim 2.7\ \text{g/cm}^3$) and the denser Sima (oceanic crust, rich in Silica & Magnesium, basaltic, $\sim 3.0\ \text{g/cm}^3$). The internal boundary separating the upper granitic (Sial) crust from the lower basaltic (Sima) crust is the Conrad Discontinuity.
2. The Mantle: Extends from the base of the crust to a depth of ~2900 km, occupying ~83% of Earth's volume. It is composed of dense, iron- and magnesium-rich silicate rocks (peridotite, olivine, pyroxene). The upper mantle contains the plastic, semi-molten asthenosphere, over which the rigid lithospheric plates glide. The boundary between the crust and the mantle is the Mohorovičić Discontinuity (Moho), marked by a sudden increase in seismic (P-wave) velocity.
3. The Core: The innermost dense metallic sphere (2900 km to 6371 km), composed mainly of Iron and Nickel (Nife), with density up to $13\ \text{g/cm}^3$. It has two parts: the outer core (liquid, ~2900–5150 km — its convective flow of molten metal generates Earth's magnetic field) and the inner core (solid, ~5150 km to centre, due to immense pressure despite temperatures of ~5000–6000°C). The boundary between the mantle and the outer core is the Gutenberg Discontinuity, across which secondary (S) waves are stopped and primary (P) waves are sharply refracted — proving the outer core is liquid.
7. What do you mean by soil pollution?
Soil pollution (land pollution) is the degradation of the Earth's land surface caused by the addition of unwanted toxic chemical substances, salts, pathogens, or radioactive materials that adversely alter the physical, chemical, and biological properties of the soil, thereby reducing its fertility and making it harmful to plants, animals, and humans.
Major causes/sources:
- Agricultural chemicals: Excessive use of chemical fertilisers, pesticides, herbicides, and insecticides (e.g., DDT) that persist and accumulate in soil.
- Industrial wastes: Discharge of toxic effluents, sludge, fly ash, and heavy metals ($\text{Pb}$, $\text{Hg}$, $\text{Cd}$, $\text{As}$).
- Solid & hazardous waste dumping: Municipal garbage, plastics, e-waste, and biomedical waste dumped on open land.
- Improper landfill leachate seeping into surrounding soil.
- Acid rain, mining spoils, and deforestation causing erosion and loss of topsoil.
Effects: Loss of soil fertility and reduced agricultural productivity; entry of toxins into the food chain via bioaccumulation/biomagnification; contamination of groundwater; destruction of beneficial soil microflora and fauna; and soil salinisation/desertification.
8. Write the effects of hazardous wastes on the environment and human health.
Improperly managed hazardous wastes (heavy metals, toxic chemicals, radioactive residues, and persistent organic pollutants) inflict severe and often irreversible damage on both ecosystems and public health.
| Effects on the Environment | Effects on Human Health |
|---|---|
| Soil Contamination: Toxic heavy metals and chemicals destroy soil fertility and beneficial microflora, rendering land barren. | Carcinogenic Effects: Exposure to Benzene, Arsenic, Vinyl chloride, and radioactive waste induces cancers (leukaemia, lung, skin, bladder). |
| Groundwater Pollution: Leachate percolates through soil, poisoning aquifers with non-biodegradable toxins that persist for decades. | Neurological Disorders: Mercury poisoning causes Minamata disease (nervous-system damage); Lead impairs brain development in children. |
| Surface Water & Aquatic Damage: Runoff contaminates rivers and lakes, killing fish and disrupting aquatic ecosystems. | Bone & Kidney Damage: Cadmium exposure causes Itai-Itai disease (bone softening) and renal failure. |
| Bioaccumulation & Biomagnification: Persistent toxins (DDT, PCBs, mercury) concentrate up the food chain, causing reproductive failure in apex predators. | Respiratory & Skin Disorders: Toxic fumes and corrosive chemicals cause asthma, bronchitis, chemical burns, and dermatitis. |
| Air Pollution & Fires: Incineration or accidental combustion releases carcinogenic dioxins, furans, and toxic acid gases. | Mutagenic & Teratogenic Effects: Genetic mutations, birth defects, and congenital disorders in offspring, as seen after the Bhopal Gas Tragedy (1984). |
| Loss of Biodiversity: Chronic toxicity eliminates sensitive species and disrupts ecological balance. | Acute Poisoning: High-dose exposure to corrosive/reactive waste can cause immediate organ failure and death. |
9. What is Rock Cycle? Discuss the composition of Lithosphere.
The Rock Cycle is a fundamental, continuous, and cyclic geological process that describes the dynamic transformation of the three major rock types — igneous, sedimentary, and metamorphic — from one form into another over geological time, driven by both internal (heat, pressure, volcanism) and external (weathering, erosion, deposition) Earth processes. Matter is never lost; it is continuously recycled between the Earth's interior and surface.
- Igneous Rocks: Formed by the cooling and solidification of molten magma (intrusive, e.g., granite) or lava (extrusive, e.g., basalt).
- Sedimentary Rocks: Formed by weathering, erosion, transportation, deposition, and compaction (lithification) of rock fragments and organic remains, e.g., sandstone, limestone.
- Metamorphic Rocks: Formed when pre-existing rocks are altered deep underground by intense heat and pressure (metamorphism) without melting, e.g., marble (from limestone), slate (from shale).
Figure: The Rock Cycle — continuous transformation among Igneous, Sedimentary, and Metamorphic rocks via magma, driven by cooling, weathering, deposition, heat & pressure, and melting.
Composition of the Lithosphere: The lithosphere is the rigid, outermost solid shell of the Earth, comprising the entire crust and the uppermost rigid part of the mantle (up to ~100 km depth). It is broken into tectonic plates. Chemically, it is composed predominantly of silicate minerals. By weight, the eight most abundant elements are:
Elemental composition of the lithosphere (approx. % by weight):
Oxygen ($\text{O}$) $\approx 46.6\%$ • Silicon ($\text{Si}$) $\approx 27.7\%$ • Aluminium ($\text{Al}$) $\approx 8.1\%$ • Iron ($\text{Fe}$) $\approx 5.0\%$ • Calcium ($\text{Ca}$) $\approx 3.6\%$ • Sodium ($\text{Na}$) $\approx 2.8\%$ • Potassium ($\text{K}$) $\approx 2.6\%$ • Magnesium ($\text{Mg}$) $\approx 2.1\%$.
Since Oxygen and Silicon together constitute over 74%, the lithosphere is essentially a silicate framework. Mineralogically it is dominated by feldspars, quartz, pyroxenes, amphiboles, micas, and olivine. The upper continental crust (Sial) is granitic (Si + Al rich), while the lower/oceanic crust (Sima) is basaltic (Si + Mg rich).
10. Discuss solid waste management and control for hazardous and biomedical waste together.
Hazardous and biomedical wastes are the two most dangerous streams of solid waste; both are potentially toxic or infectious and therefore demand rigorous, specialised, and legally regulated management following the principle of "cradle-to-grave" control — accountability from generation to final disposal. Their management follows a common integrated framework of segregation → collection → treatment → disposal, with stream-specific safeguards.
General Integrated Management Steps:
- Segregation at Source: Waste is separated at the point of generation into labelled, colour-coded, leak-proof, and puncture-resistant containers to prevent mixing with general refuse.
- Collection & Safe Storage: Stored in designated secure areas for a limited period (BMW ≤ 48 hours) with clear hazard labelling and restricted access.
- Transportation: Moved only in dedicated, licensed, spill-proof vehicles accompanied by a tracking manifest document.
- Treatment / Detoxification: Infectious BMW is disinfected by autoclaving, microwaving, or chemical disinfection; hazardous chemical waste is neutralised, stabilised/solidified (encapsulated), or detoxified to immobilise toxins.
- Final Disposal: Destruction by high-temperature incineration and burial of inert residue/ash in Secured Landfills (TSDFs) with double liners, leachate collection, and long-term monitoring; deep-well injection or vitrification for special liquid/radioactive waste.
| Basis | Hazardous Waste | Biomedical Waste |
|---|---|---|
| Source | Chemical, metal, pesticide & nuclear industries | Hospitals, clinics, labs, blood banks |
| Primary Hazard | Toxic, corrosive, reactive, ignitable (ICRT) | Infectious, pathological, sharps injury |
| Governing Rule (India) | Hazardous & Other Wastes Rules, 2016 | Bio-Medical Waste Management Rules, 2016 |
| Segregation | Hazard-symbol coded, corrosion-resistant drums | Yellow / Red / White / Blue colour-coded bins |
| Key Treatment | Neutralisation, stabilisation, secured landfill, incineration | Autoclaving, microwaving, incineration, deep burial |
| Disposal Facility | TSDF / secured landfill / deep-well injection | Common Bio-medical Waste Treatment Facility (CBWTF) |
Control & Safeguard Measures common to both: use of trained personnel with full PPE; strict record-keeping and manifest tracking; regular monitoring of air, soil, and groundwater around disposal sites; adherence to statutory rules and pollution-control-board authorisation; and public awareness with emergency-response plans for accidental spills.
Module 6 — Noise Pollution & Control 10 Questions
1. Define noise and noise pollution. How much is a sound of 100 dB louder than a sound of 90 dB (numerical)?
Noise is any unwanted, unpleasant or undesirable sound that causes discomfort, annoyance or damage to the listener. Physically it is an aperiodic, irregular vibration lacking the harmonic structure of musical sound.
Noise pollution is the presence of excessive or persistent noise in the environment at levels that interfere with human comfort, health or activity, and that harm other living organisms. It is a non-persistent, non-cumulative pollutant (it disappears once the source stops, leaving no residue), yet its physiological and psychological effects can be lasting.
Sound level is compared on the decibel (dB) scale, which is logarithmic:
$$\text{SIL} = 10\log_{10}\frac{I}{I_0}, \qquad I_0 = 10^{-12}\,\text{W/m}^2$$Intensity ratio for a level difference $\Delta L$:
$$\frac{I_1}{I_2} = 10^{\Delta L/10}$$- Given: $L_1 = 100\,\text{dB}$, $L_2 = 90\,\text{dB}$.
- Step 1 — Level difference: $\Delta L = 100 - 90 = 10\,\text{dB}$.
- Step 2 — Intensity ratio: $$\frac{I_1}{I_2} = 10^{\Delta L/10} = 10^{10/10} = 10^1 = 10$$
- Step 3 — Loudness perception: Perceived loudness roughly doubles for every 10 dB increase.
Result: A 100 dB sound carries 10 times the acoustic intensity (energy) of a 90 dB sound, yet subjectively it is perceived as only about twice as loud to the human ear. This mismatch between physical energy and perceived loudness is the hallmark of the logarithmic decibel scale.
2. Given permissible exposure durations at various dB levels, determine whether the combined noise level exceeds the limit (numerical) and comment on worker health.
Occupational safety limits are expressed as a noise dose — the fraction of the permissible daily exposure a worker actually receives, summed over all exposure periods. The 100% dose corresponds to the maximum permissible daily exposure (typically 90 dB(A) for 8 hours).
where $C_i$ = actual hours spent at level $i$, and $T_i$ = permitted hours at that level. If $D > 100\%$, the limit is exceeded.
Given (a typical factory worker's day, OSHA-style permissible durations):
| Noise level (dB) | Permitted duration $T_i$ (h) | Actual exposure $C_i$ (h) | Partial dose $C_i/T_i$ |
|---|---|---|---|
| 90 | 8 | 4 | $4/8 = 0.50$ |
| 95 | 4 | 2 | $2/4 = 0.50$ |
| 100 | 2 | 2 | $2/2 = 1.00$ |
- Step 1 — Sum the partial doses: $$\sum \frac{C_i}{T_i} = 0.50 + 0.50 + 1.00 = 2.00$$
- Step 2 — Convert to percentage dose: $$D = 2.00 \times 100\% = 200\%$$
- Step 3 — Compare with limit: $D = 200\% > 100\%$.
Result: The dose is 200%, i.e. twice the permissible limit, so the combined exposure clearly exceeds the safe limit.
Comment on worker health: Sustained exposure at 200% dose places the worker at serious risk of Noise-Induced Hearing Loss (NIHL) and permanent threshold shift, tinnitus, hypertension, elevated stress hormones and fatigue. Immediate controls are required: engineering controls (enclosures, silencers), administrative controls (job rotation to halve exposure time) and personal protective equipment (ear plugs ~15–20 dB, ear muffs ~25–30 dB attenuation). Providing ear muffs alone (~30 dB) would bring effective levels well within the 90 dB limit.
3. What is noise? Explain the sources of noise pollution and how it can be controlled at the source.
Noise is unwanted sound — an irregular, non-harmonic pressure fluctuation in air that is perceived as disturbing or harmful. Its intensity is measured in decibels, dB(A) (A-weighted to mimic the ear's frequency response).
Sources of noise pollution:
| Category | Examples | Typical level |
|---|---|---|
| Transport / Traffic | Road vehicles, horns, railways, aircraft take-off | 70–120 dB |
| Industrial / Occupational | Machinery, compressors, boilers, hammering, turbines | 80–120 dB |
| Construction | Pile drivers, drills, concrete mixers, bulldozers | 90–110 dB |
| Neighbourhood / Domestic | Loudspeakers, TV, generators, mixers, festivals | 50–90 dB |
| Natural | Thunder, volcanic eruption, storms | Variable |
Control at the source (the most effective approach):
- Design / substitution: Use quieter machines, replace impact processes with smoother ones (e.g. welding for riveting), belt drives for gears.
- Maintenance & lubrication: Regular oiling and tightening of loose parts reduces friction and rattle noise.
- Vibration isolation: Mount machines on rubber/spring anti-vibration pads and resilient foundations to damp structure-borne noise.
- Enclosures & silencers: Fit acoustic hoods over machines and mufflers/silencers on exhausts and intakes.
- Reducing turbulence: Streamlined ducts and lower fan/flow speeds cut aerodynamic noise.
- Banning horns / regulating: "No-honking" zones and speed limits reduce traffic noise at origin.
4. Explain the harmful effects of noise pollution on human health and migratory birds.
Effects on human health:
- Auditory (hearing) effects: Temporary Threshold Shift (TTS) — reversible loss after short exposure; Permanent Threshold Shift (PTS) / NIHL — irreversible damage to cochlear hair cells above ~85–90 dB prolonged; tinnitus (ringing) and, at ~150 dB, rupture of the eardrum.
- Physiological (non-auditory): raised blood pressure and hypertension, increased heart rate, release of stress hormones (adrenaline, cortisol), digestive disturbances (peptic ulcers), muscle tension and headaches.
- Psychological: annoyance, irritability, anxiety, sleep disturbance, reduced concentration and work efficiency, fatigue.
- Effect on communication: masking of speech, interference with warning signals — leading to accidents.
Effects on migratory birds:
- Communication masking: Traffic and industrial noise drown out bird song and calls used for mating, territory and warning, lowering breeding success.
- Disorientation of navigation: Loud, sudden noise (aircraft, blasting) disrupts the acoustic and quiet cues migratory birds rely on, altering flight paths and stopover behaviour.
- Physiological stress: Elevated stress hormones reduce feeding, cause abandonment of nests and lower reproductive output.
- Habitat avoidance: Birds abandon noisy wetlands and roosting sites, shrinking usable habitat and disturbing established migratory routes and populations.
5. What is the unit of measurement of sound? Define Sound Pressure Level (SPL) and express it mathematically.
The unit of sound level is the decibel (dB) — a dimensionless, logarithmic ratio of a measured quantity to a fixed reference. For frequency weighting matched to human hearing, the dB(A) scale is used. (The bel is the base unit; 1 bel = 10 decibels.)
Sound Pressure Level (SPL) is the logarithmic measure of the effective (RMS) sound pressure $p$ of a wave relative to a standard reference pressure $p_0$ (the threshold of human hearing).
The factor 20 (not 10) arises because sound intensity $\propto p^2$, so $10\log_{10}(p/p_0)^2 = 20\log_{10}(p/p_0)$.
Worked example: If $p = 2\,\text{Pa}$, $$\text{SPL} = 20\log_{10}\frac{2}{2\times10^{-5}} = 20\log_{10}(10^{5}) = 20\times 5 = 100\,\text{dB}.$$ Thus 0 dB corresponds to the hearing threshold ($p = p_0$), and everyday speech is ~60 dB.
6. What is noise threshold limit value (TLV)? Discuss mechanisms to control noise.
The Threshold Limit Value (TLV) of noise is the maximum permissible sound level to which a worker may be exposed for a stated duration without risk of hearing damage. The reference TLV is 90 dB(A) for 8 hours per day. For every increase of ~5 dB, the permitted exposure time is halved (the "exchange rate"):
| Sound level dB(A) | Permissible daily exposure |
|---|---|
| 90 | 8 hours |
| 95 | 4 hours |
| 100 | 2 hours |
| 105 | 1 hour |
| 110 | 30 minutes |
| 115 | 15 minutes (ceiling) |
Mechanisms to control noise — three levels:
- Control at the source: quieter machinery, lubrication, vibration isolation mounts, silencers/mufflers, acoustic enclosures.
- Control along the path (transmission): increase distance (level falls ~6 dB per doubling of distance), erect noise barriers / green belts of trees, use sound-absorbing materials (glass wool, acoustic tiles), and insulate walls.
- Control at the receiver: PPE — ear plugs (~15–20 dB) and ear muffs (~25–30 dB); job rotation to limit exposure time; soundproof control cabins; regular audiometric monitoring.
- Legislative / administrative: enforce Noise Pollution (Regulation & Control) Rules, silence zones near hospitals/schools, and night-time restrictions.
7. Write a short note on Sound Intensity Level (SIL).
Sound Intensity Level (SIL) expresses the acoustic intensity $I$ (power carried by the wave per unit area, W/m²) on a logarithmic decibel scale relative to a reference intensity $I_0$, taken as the threshold of hearing.
Note the factor 10 (intensity is a power-like quantity), whereas SPL uses 20 (pressure quantity). Numerically, in a free field, SIL ≈ SPL.
- At the threshold of hearing $I = I_0$, so $\text{SIL} = 10\log_{10}(1) = 0\,\text{dB}$.
- The threshold of pain is $I = 1\,\text{W/m}^2$, giving $\text{SIL} = 10\log_{10}(10^{12}) = 120\,\text{dB}$.
- A 10-fold rise in intensity adds exactly 10 dB; a doubling of intensity adds $10\log_{10}2 \approx 3\,\text{dB}$.
Worked example: For $I = 10^{-6}\,\text{W/m}^2$: $$\text{SIL} = 10\log_{10}\frac{10^{-6}}{10^{-12}} = 10\log_{10}(10^{6}) = 60\,\text{dB}.$$
8. Classify types of noise (Transport, Occupational, Neighbourhood) and define $L_{eq}$ and $L_{10}$.
Classification of noise by source:
| Type | Origin | Examples |
|---|---|---|
| Transport noise | Movement of vehicles | Road traffic & horns, railways, aircraft — largest contributor in cities |
| Occupational (industrial) noise | Workplace machinery | Factory machines, compressors, looms, turbines, drilling |
| Neighbourhood (domestic) noise | Community & household | Loudspeakers, TV, generators, mixers, weddings, festivals, markets |
Equivalent continuous level $L_{eq}$: the single steady dB level that contains the same total sound energy as the actual fluctuating noise over a period $T$. It is the energy-averaged level:
$$L_{eq} = 10\log_{10}\!\left(\frac{1}{T}\int_0^T \frac{p^2(t)}{p_0^2}\,dt\right) = 10\log_{10}\!\left(\frac{1}{N}\sum_i 10^{L_i/10}\right)$$Percentile level $L_{10}$: the sound level (dB) that is exceeded for 10% of the measurement time. It represents the intermittent peak/high-noise events (e.g. passing vehicles). Likewise $L_{90}$ ≈ background level; $L_{50}$ = median.
Thus $L_{eq}$ characterises average exposure while $L_{10}$ characterises the noisy peaks — both are widely used in traffic-noise standards.
9. What is noise dose, as recommended by the Noise Control Board?
Noise dose ($D$) is the cumulative amount of noise energy a worker receives during a working day, expressed as a percentage of the maximum permissible daily exposure. A dose of 100% equals the allowable limit (8 h at 90 dB(A)); anything above 100% is unsafe.
$C_i$ = actual time spent at noise level $i$; $T_i$ = permitted time at that level (from the TLV table).
- $D \le 100\%$ → exposure is within safe limits.
- $D > 100\%$ → limit exceeded; corrective controls (PPE, job rotation, engineering measures) are mandatory.
- Quick example: 6 h at 90 dB ($T=8$) and 2 h at 95 dB ($T=4$): $$D = \left(\frac{6}{8}+\frac{2}{4}\right)\times100 = (0.75+0.50)\times100 = 125\%.$$ Since $125\% > 100\%$, the worker is over-exposed.
10. If two machines produce given dB sounds simultaneously, calculate the total combined sound level (numerical).
Decibels cannot be added arithmetically because the scale is logarithmic — instead the acoustic energies (intensities) are added and then converted back to dB.
- Given: Machine 1 = $L_1 = 80\,\text{dB}$, Machine 2 = $L_2 = 85\,\text{dB}$, running together.
- Step 1 — Convert each level to an energy term: $$10^{L_1/10} = 10^{80/10} = 10^{8} \qquad 10^{L_2/10} = 10^{85/10} = 10^{8.5} = 3.162\times10^{8}$$
- Step 2 — Add the energies: $$10^{8} + 3.162\times10^{8} = 4.162\times10^{8}$$
- Step 3 — Convert back to dB: $$L_{total} = 10\log_{10}(4.162\times10^{8}) = 10\times 8.619 = 86.19\,\text{dB}$$
Result: The combined level is $\boxed{L_{total} \approx 86.2\,\text{dB}}$.
Note: Adding an 80 dB source to an 85 dB source raises the total by only ~1.2 dB, not 5 dB — a quieter source contributes little to the total. (Two equal sources, e.g. 85 dB + 85 dB, would add exactly $10\log_{10}2 \approx 3\,\text{dB}$, giving 88 dB.)
Module 7 — Environmental Management 8 Questions
1. What do you mean by Environmental Impact Assessment (EIA)? How is it related to setting up a new process industry? Describe its methodology.
A. Meaning of EIA:
Environmental Impact Assessment (EIA) is a formal, systematic, and anticipatory planning tool used to identify, predict, evaluate, and mitigate the biophysical, socio-economic, cultural, and human-health consequences of a proposed major development project before irreversible decisions are taken and financial commitments are made. It institutionalises the Precautionary Principle—preventing environmental degradation at the source rather than attempting costly remediation afterwards—and functions as the scientific backbone for granting Environmental Clearance (EC) under the EIA Notification, 2006 (India).
B. Relationship with Setting Up a New Process Industry:
Before a new chemical, petrochemical, cement, thermal-power, tannery, pharmaceutical, or metallurgical process industry can be commissioned, it must legally undergo EIA (as a Category A or Category B project). The linkage is direct and mandatory for the following reasons:
- Site Suitability & Siting Decisions: EIA verifies whether the chosen site is at a safe distance from ecologically sensitive zones (wildlife sanctuaries, wetlands, coastal regulation zones, dense settlements) before land is acquired.
- Pollution Load Forecasting: It quantifies the anticipated gaseous emissions ($\text{SO}_2$, $\text{NO}_x$, $\text{PM}_{2.5}$), liquid effluent discharge ($\text{BOD}$, $\text{COD}$, heavy metals), and hazardous solid/toxic waste the process will generate at full capacity.
- Design of Control Systems: It dictates the mandatory installation of Effluent Treatment Plants (ETP), scrubbers, Electrostatic Precipitators (ESP), and stack-height design at the drawing-board stage, which is cheaper than retrofitting.
- Environmental Management Plan (EMP): The industry must submit a binding EMP (greenbelt development, zero-liquid-discharge, disaster-management plan) as a precondition of consent to establish (CTE) and consent to operate (CTO) from the State Pollution Control Board.
- Risk & Disaster Mitigation: Post the Bhopal Gas Tragedy (1984), EIA includes a Rapid Risk Assessment to prevent catastrophic accidental releases from process industries handling hazardous substances.
Thus, EIA is the regulatory gateway that harmonises industrial economic growth with the environment's assimilative carrying capacity, ensuring the project embodies sustainable development.
C. Methodology of EIA:
EIA proceeds through a logically sequenced, iterative workflow. The principal stages are enumerated below:
- Screening: The preliminary filter that decides whether a project legally requires a full EIA. Projects are sorted (per the schedule/threshold of the EIA Notification) into Category A (appraised centrally by MoEFCC) or Category B (appraised by the State-level SEIAA), and low-impact projects are exempted.
- Scoping: Defining the spatial and temporal boundaries of the study and identifying the significant environmental attributes (Valued Environmental Components) that must be investigated. It culminates in the issuance of the Terms of Reference (ToR).
- Baseline Data Collection: Measurement of the pre-project ambient status of air quality, surface/ground water, noise, soil, flora–fauna (biodiversity), land use, meteorology, and the socio-economic profile of the study area.
- Impact Prediction & Assessment: Forecasting the magnitude, extent, duration, and reversibility of impacts using tools such as mathematical dispersion models, overlay (GIS) maps, checklists, network diagrams, and the Leopold Matrix.
- Mitigation & Environmental Management Plan (EMP): Formulating concrete preventive, remedial, and compensatory measures (ETPs, ESPs, greenbelt buffers, rainwater harvesting, compensatory afforestation, rehabilitation packages) into a time-bound, budgeted, legally binding EMP.
- Public Hearing / Public Consultation: A mandatory, transparent forum where project-affected persons, local communities, and NGOs voice concerns, documented and incorporated into the final assessment.
- Preparation of EIS / EIA Report: Compilation of all findings into the comprehensive Environmental Impact Statement (EIS), with a non-technical Executive Summary.
- Review & Decision-Making (Environmental Clearance): An Expert Appraisal Committee (EAC/SEAC) scrutinises the report and either grants Environmental Clearance with safeguards, recommends modifications, or rejects ecologically unviable proposals.
- Post-Project Monitoring & Environmental Auditing: Continuous verification during construction and operation that actual impacts remain within predicted limits and that the EMP commitments are honoured.
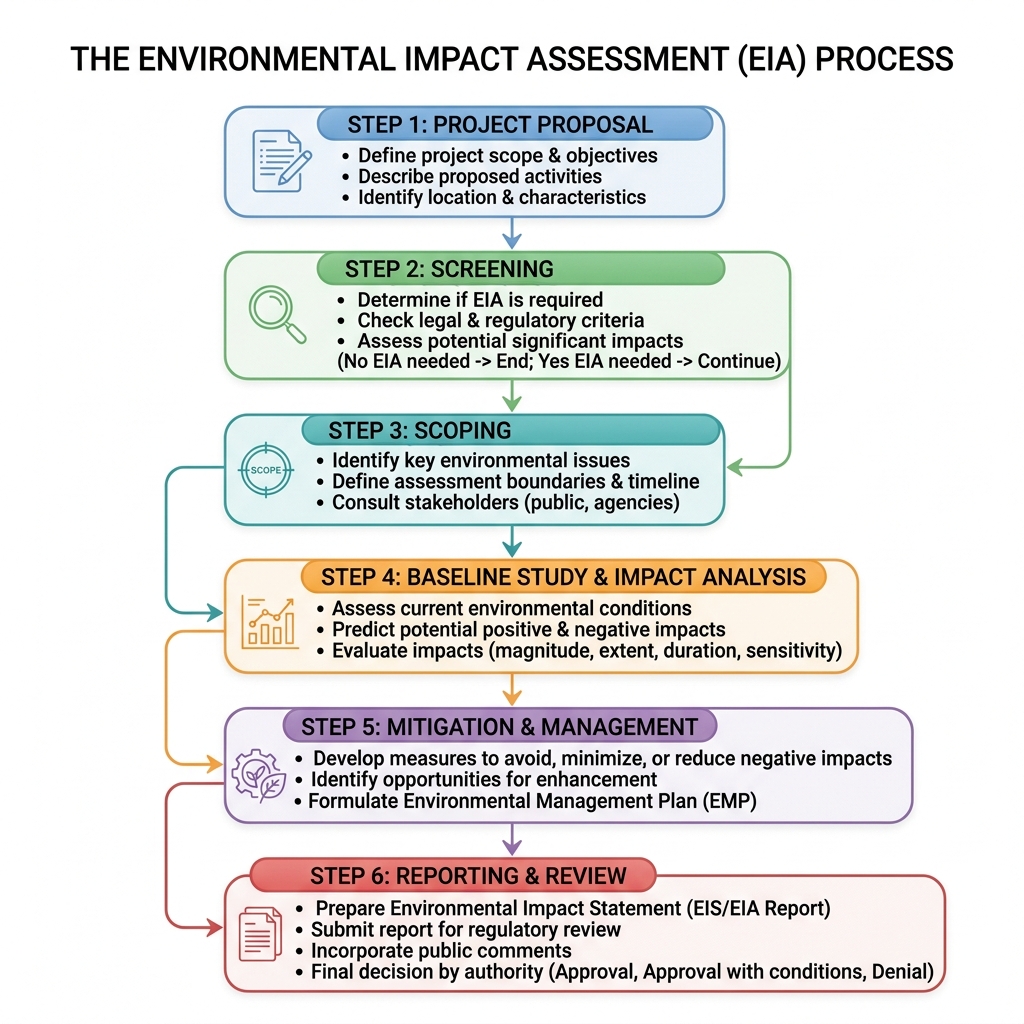
Figure: Sequential stages of the Environmental Impact Assessment (EIA) workflow — screening to post-project monitoring.
2. How is environmental audit done? What is its utility?
Environmental Audit (Eco-Audit) is a systematic, documented, and periodic examination of an organisation's operations, processes, and management systems to verify compliance with statutory environmental regulations, permit conditions, and its own internal environmental policy. Unlike EIA (which is predictive, done before a project), the environmental audit is retrospective/verificatory, conducted on an operational facility. In India, industries must file an annual Environmental Statement (Form-V) to the State Pollution Control Board by 30th September each year (Environment Protection Rules).
Methodology — How an Environmental Audit is Conducted:
- Pre-Audit (Planning) Phase: Defining the audit's scope and objectives, assembling a qualified multidisciplinary team, reviewing background documents (consents, past records, process flow sheets), and preparing audit protocols and questionnaires.
- On-Site (Field) Phase: Physical inspection of the plant, verification of pollution-control equipment, sampling and monitoring of emissions/effluents, examination of records, and interviewing operating personnel to collect objective audit evidence.
- Material & Energy Balance: Preparing an input–output inventory of raw materials, water, and energy versus products, by-products, and waste streams to locate inefficiencies and resource-conservation opportunities.
- Evaluation & Gap Analysis: Comparing observed performance against regulatory standards to identify non-conformities, deficiencies, and areas of environmental risk.
- Post-Audit (Reporting) Phase: Preparing the audit report documenting findings, recommending corrective actions with timelines, and instituting a follow-up mechanism to verify implementation.
Utility / Significance of Environmental Audit:
- Regulatory Compliance: Ensures the unit stays within legal discharge standards, avoiding prosecution, penalties, and closure orders.
- Cost Savings & Waste Minimisation: Identifies opportunities for resource conservation, recycling, and cleaner production, lowering costs.
- Risk Reduction: Detects potential hazards and process weaknesses early, preventing accidents and liabilities.
- Corporate Image & Market Access: Demonstrates environmental responsibility, aiding ISO 14001 certification, green branding, and export-market access.
- Improved Management & Data Base: Provides management with reliable data for informed policy decisions and continual improvement.
3. Write short notes on: (a) Environmental Management System (EMS) (b) Conference of Parties (COP)-21, Paris.
(a) Environmental Management System (EMS): An EMS is a structured framework of policies, procedures, processes, and organisational resources that an enterprise adopts to systematically manage its environmental impacts, achieve legal compliance, and pursue continual improvement in environmental performance. The internationally recognised standard is ISO 14001. The EMS operates on the Deming Cycle — Plan–Do–Check–Act (PDCA):
- Plan: Establish an environmental policy, identify significant aspects/impacts and legal requirements, and set measurable objectives and targets.
- Do (Implement): Allocate roles, provide training, ensure documentation, operational control, and emergency preparedness.
- Check: Monitor and measure performance, conduct internal audits, and evaluate compliance.
- Act: Undertake management review and corrective/preventive action, feeding back into continual improvement.
Benefits: regulatory compliance, reduced waste and liability, cost savings, enhanced reputation, and improved stakeholder confidence.
(b) Conference of Parties (COP)-21, Paris (2015): COP-21 was the 21st session of the Conference of the Parties to the UNFCCC, held in Paris, December 2015. It produced the landmark Paris Agreement, the first universal, legally binding global climate accord, adopted by 196 parties. Its salient features:
- Long-Term Temperature Goal: Hold the rise in global average temperature to well below $2^\circ\text{C}$ above pre-industrial levels and pursue efforts to limit it to $1.5^\circ\text{C}$.
- Nationally Determined Contributions (NDCs): Each country sets and progressively strengthens its own voluntary emission-reduction pledges, reviewed every five years (the "ratchet mechanism").
- Climate Finance: Developed nations committed to mobilise US \$100 billion per year for mitigation and adaptation in developing countries.
- Carbon Neutrality: Achieve a balance between anthropogenic emissions and removals by sinks in the second half of the century (net-zero).
- Principle of Equity: Based on Common But Differentiated Responsibilities and Respective Capabilities (CBDR-RC).
4. Discuss the important environmental laws and protection acts of India.
India possesses a comprehensive legislative framework for environmental protection, drawing constitutional strength from Article 48-A (Directive Principle: State to protect and improve the environment) and Article 51-A(g) (Fundamental Duty of every citizen to protect the natural environment). The principal statutes are tabulated below:
| Act / Legislation | Year | Purpose & Key Provisions |
|---|---|---|
| Wildlife (Protection) Act | 1972 | Protects wild animals, birds, and plants; establishes National Parks, Wildlife Sanctuaries, and Biosphere Reserves; prohibits poaching and illegal trade in endangered species. |
| Water (Prevention & Control of Pollution) Act | 1974 | First comprehensive water-pollution law; constituted the Central and State Pollution Control Boards (CPCB/SPCBs); mandates "consent to establish/operate"; prescribes discharge standards. |
| Forest (Conservation) Act | 1980 | Restricts the diversion of forest land for non-forest purposes without prior Central Government approval; checks deforestation; mandates compensatory afforestation. |
| Air (Prevention & Control of Pollution) Act | 1981 | Provides for prevention, control, and abatement of air pollution; empowers Boards to declare "air pollution control areas" and set ambient air-quality & emission standards. |
| Environment (Protection) Act — "Umbrella Act" | 1986 | Enacted after the Bhopal Gas Tragedy under Article 253; overarching legislation empowering the Central Government to set standards, regulate hazardous substances, and take direct action. Parent act for the EIA Notification (2006), Hazardous, Bio-Medical, and Plastic Waste Rules. |
| Public Liability Insurance Act | 1991 | Provides immediate mandatory "no-fault" relief and compulsory insurance to victims of accidents from the handling of hazardous substances. |
| Biological Diversity Act | 2002 | Conserves biodiversity, ensures sustainable use of biological resources, and provides for fair, equitable sharing of benefits (ABS); established the National Biodiversity Authority (NBA). |
| National Green Tribunal (NGT) Act | 2010 | Established the specialised National Green Tribunal for speedy disposal of environmental cases, applying the Polluter Pays and Precautionary Principles. |
Together these statutes, administered chiefly by the Ministry of Environment, Forest & Climate Change (MoEFCC) and the Pollution Control Boards, embody India's commitment to sustainable development and the Polluter Pays Principle.
5. What are the different international environmental treaties/protocols relevant to pollution control?
To address transboundary and global environmental problems that no single nation can solve alone, the international community has negotiated several multilateral environmental agreements. The most significant treaties and protocols relevant to pollution control are tabulated below:
| Treaty / Protocol | Year | Objective & Focus Area |
|---|---|---|
| Ramsar Convention | 1971 | Convention on Wetlands of International Importance; conserves and promotes the wise use of wetland ecosystems and their biodiversity (signed at Ramsar, Iran). |
| Stockholm Conference | 1972 | UN Conference on the Human Environment; the first major global summit on the environment; led to the creation of UNEP (World Environment Day — 5 June). |
| CITES | 1973 | Convention on International Trade in Endangered Species of wild fauna and flora; regulates and restricts cross-border trade to prevent over-exploitation. |
| Montreal Protocol | 1987 | Protocol on Substances that Deplete the Ozone Layer; mandates the phase-out of ozone-depleting substances (CFCs, halons). The most successful environmental treaty. |
| Basel Convention | 1989 | Controls the transboundary movement of hazardous wastes and their disposal, preventing dumping of toxic waste from developed into developing nations. |
| Kyoto Protocol | 1997 | Under the UNFCCC; set legally binding greenhouse-gas targets for developed (Annex-I) nations; introduced CDM, Emissions Trading, Joint Implementation. |
| Stockholm Convention on POPs | 2001 | Eliminates/restricts Persistent Organic Pollutants (the "dirty dozen" — DDT, dioxins, PCBs, furans) that bio-accumulate and persist. |
| Paris Agreement | 2015 | Universal climate accord (COP-21) to limit global warming to well below $2^\circ\text{C}$ (aiming for $1.5^\circ\text{C}$) through NDCs and climate finance. |
6. What is the full form and significance of EQI (Environmental Quality Index)?
Full Form: EQI stands for Environmental Quality Index.
Definition: The Environmental Quality Index (EQI) is a single, dimensionless composite numerical value that aggregates several individual environmental parameters (air quality, water quality, noise levels, soil quality, biodiversity indicators) into one representative score reflecting the overall ecological health and quality of a given environment or region. It converts complex, multi-parameter scientific data into a simplified, comparable index.
General Form: $$\text{EQI} = \sum_{i=1}^{n} W_i \, Q_i$$ where $Q_i$ is the sub-index (quality rating) of the $i^{\text{th}}$ environmental parameter, $W_i$ is its relative weight (with $\sum W_i = 1$), and $n$ is the total number of parameters considered.
Significance / Utility:
- Simplification & Communication: Condenses voluminous technical data into one easily interpretable number for policymakers, planners, and the public.
- Spatial & Temporal Comparison: Enables comparison of environmental quality between locations and tracking of trends over time.
- Policy & Decision Support: Assists authorities in prioritising pollution-control interventions and evaluating remedial programmes.
- Public Awareness: Raises environmental consciousness via a user-friendly, colour-coded presentation (analogous to the AQI).
- Benchmark for Sustainability: Indicates whether development is proceeding within the environment's carrying capacity.
7. What is Itai-Itai disease related to?
Itai-Itai disease is a chronic, painful bone and kidney disorder caused by chronic Cadmium ($\text{Cd}$) poisoning. The name "Itai-Itai" is Japanese for "ouch-ouch", expressing the severe skeletal pain suffered by patients. It was one of the four major documented pollution diseases of Japan, occurring in the Jinzu River basin, Toyama Prefecture.
Cause & Mechanism: Effluent containing cadmium discharged from zinc and lead mining/smelting operations contaminated the river water used to irrigate rice paddy fields. The rice bio-accumulated cadmium, which entered the human food chain. Chronic cadmium ingestion causes:
- Renal Tubular Damage: Cadmium injures the proximal tubules of the kidney, impairing reabsorption and causing loss of calcium and phosphate.
- Osteomalacia & Osteoporosis: The resulting demineralisation leads to softening and weakening of bones, multiple fractures, spinal deformity, and excruciating pain even on slight movement.
Significance: Itai-Itai disease is a classic textbook example of biomagnification of a heavy metal through the food chain and the human-health consequences of industrial water pollution.
8. Define EIA and list the factors considered in its methodology (socio-economic condition, rehabilitation possibility, etc.).
Definition: Environmental Impact Assessment (EIA) is a systematic, anticipatory planning process for identifying, predicting, evaluating, and mitigating the environmental, socio-economic, cultural, and human-health effects of a proposed development project prior to major decision-making, so as to ensure environmentally sound and sustainable development.
Factors Considered in EIA Methodology: A comprehensive EIA study systematically evaluates the following categories of environmental attributes:
- Air Environment: Ambient air quality, expected gaseous emissions ($\text{SO}_2$, $\text{NO}_x$, $\text{CO}$), particulate matter ($\text{PM}_{2.5}$, $\text{PM}_{10}$), and micro-meteorological dispersion conditions.
- Water Environment: Surface- and ground-water quality and quantity, effluent load ($\text{BOD}$, $\text{COD}$), drainage pattern, and impact on aquatic life.
- Land & Soil Environment: Existing land-use pattern, soil quality, erosion, solid- and hazardous-waste generation, and land degradation.
- Noise Environment: Baseline and predicted ambient noise levels (in $\text{dB(A)}$) and vibration.
- Biological (Ecological) Environment: Terrestrial and aquatic flora and fauna, endangered/endemic species, forest cover, and impacts on biodiversity and sensitive ecosystems.
- Socio-Economic Condition: Demography, employment generation, public health, literacy, infrastructure, and the local economy of the affected population.
- Rehabilitation & Resettlement (R&R) Possibility: Number of project-affected/displaced families, adequacy of compensation, availability of resettlement sites, and livelihood-restoration measures.
- Cultural & Aesthetic Factors: Impact on archaeological monuments, historical/religious sites, landscape aesthetics, and areas of scenic value.
- Public Opinion: Concerns raised by project-affected persons and stakeholders during the mandatory public hearing.
- Risk & Hazard Assessment: Probability of accidents, on-site/off-site disaster-management plans, and safety of surrounding communities.
These factors are collectively assessed—often using tools such as the Leopold Matrix, checklists, or overlay/GIS mapping—to arrive at an objective, holistic evaluation feeding into the Environmental Management Plan (EMP).